
The Weekend Update
posted on March 09, 2019 by the OEW group in honor of Anthony Caldaro
Report
The SPX gapped up on Monday to start the week at 2815 and immediately hit the high for the week at 2817. The market then began to sell off and hit 2768 by lunch before climbing higher into 2793. Tuesday was a more stable day, trading down to 2783 in the morning session then a gradual climb up to 2796 by close. Then on Wednesday the selloff continued as price moved down to 2770 and on Thursday selling saw Mondays low taken out, 2742 was hit early on, bounced back up to 2761 by lunch, back down to 2739 in the afternoon and a bounce into 2750 at close. Friday gapped down and hit 2722 early in the session, bounced up to 2736, returned to test 2723 before finishing the week at 2743
For the week, the SPX/Dow lost 2.2% while the NAS/NDX lost 2.0%.
On the economic front, we saw uptick for ISM Services, New Home Sales, and Jobless Claims. On the downtick the Nonfarm had a big miss, 20k against the forecast of 181k
Next week’s report will be highlighted by durable goods, CPI/PPI and retail sales
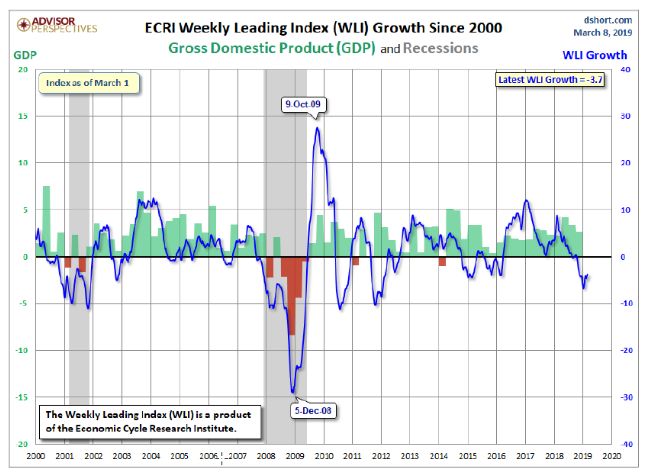
The ECRI WLI was up this week from -4.2 to -3.7
LONG TERM: uptrend strong probability
We continue to track the foreign markets as we have for the past several months. The Nifty (India) advanced this week while most other markets were in sell mode. The Dax (German) and other European indices were lower along with the BVSP (Brazil), Nikkei (Japan) and Kospi (Korea)
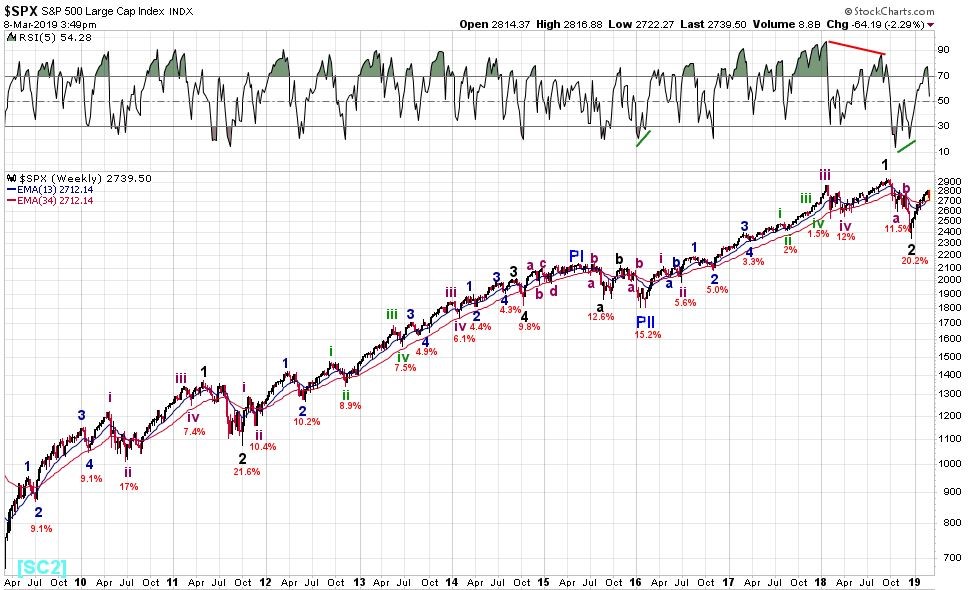
In the US, the long-term count remains unchanged. Super cycle SC2 low March 2009. Primary I high May 2015, and Primary II low February 2016. Major wave 1 high October 2018, Major wave 2 low December 2018. Intermediate wave i of Major 3 is now underway.
MEDIUM TERM: uptrend
Since what we believe is the Major 2 low, we count a possible 5 waves up complete. Minute i at 2520, Minute ii at 2444, Minute iii at 2739, Minute iv at 2682 and Minute v at 2817. We have been producing a Weekend Report for the OEW group and mentioned a couple of weeks ago that Minute v looked to be subdividing and that did indeed happen. We label this subdivision as Micro 1 at 2762, Micro 2 at 2731, Micro 3 at 2813, Micro 4 at 2775 and Micro 5 at 2817. The action possibly wrapped up Minor 1 on Monday and we believe Minor 2 has been underway since. Several of criteria we were looking at to help confirm have now been met, like a break of Micro 4 at 2775 and largest pullback of the UT from 2347. This data suggests that Minor 2 is underway and likely to confirm a DT in the coming weeks.
SHORT TERM
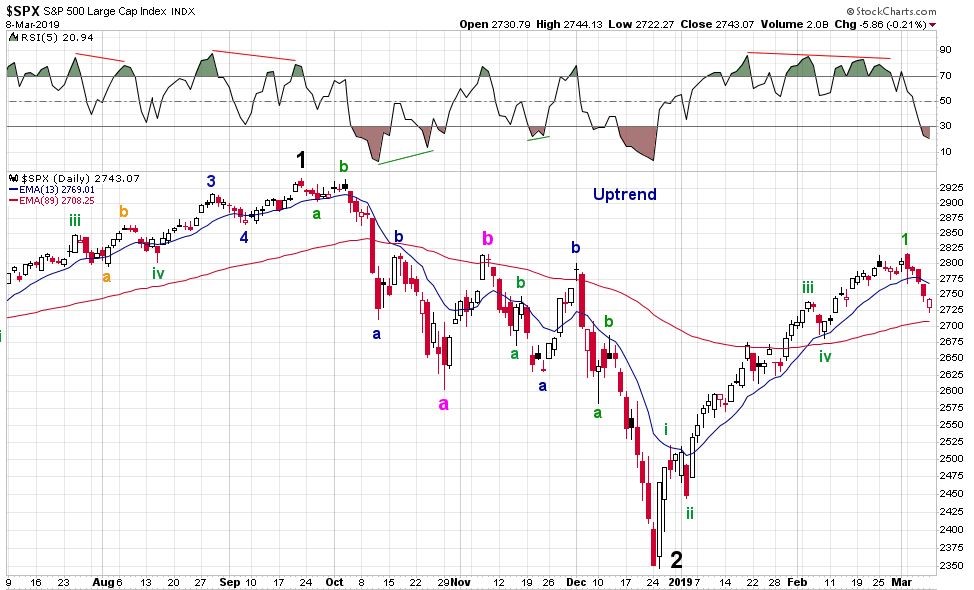
The action this week saw Minor 1 tentatively complete at the previously mentioned 2815 area of resistance which had capped both Int B and Minor B of Int A.
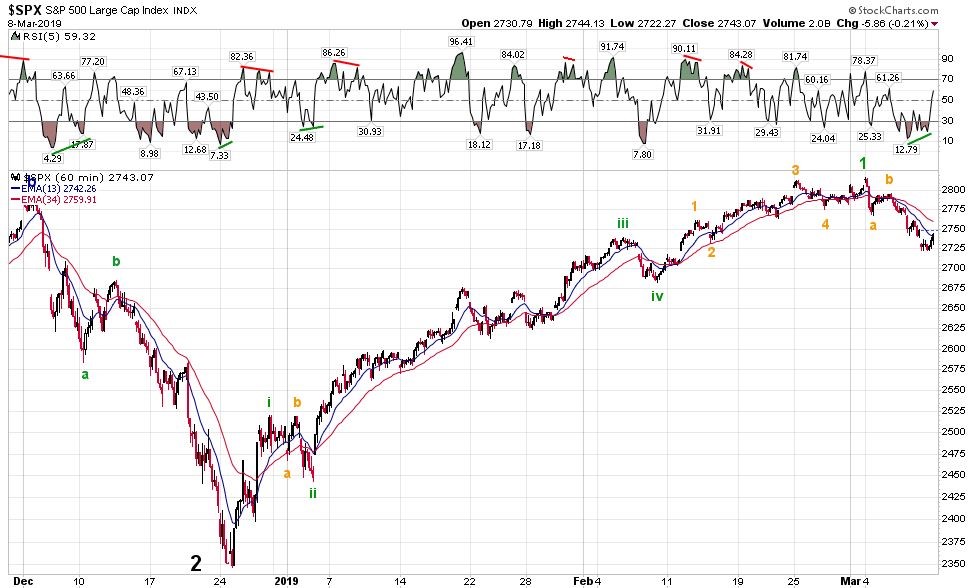
On the squiggle chart this week we have three waves down, 2817>2768>2796>2722 so far. When this completes it will likely be Minute A, we expect to see a Minute B rally before another decline for Minute C to complete Minor 2.
Short term support is at SPX 2731 and the 2656 pivots with resistance at the 2780 and 2798 pivots. There is currently positive divergence on the 60 minute chart with the daily chart now oversold.
FOREIGN MARKETS
Asian markets were down on the week and some lost as much as 2.5%.
European markets were down as well and lost 1.5%.
The DJ World index lost 2%, and the NYSE lost 2.2%.
COMMODITIES
Bonds are in a downtrend but gained 1.4%.
Crude remains in an uptrend and gained 0.5%.
Gold is in a downtrend but ended flat%.
Bitcoin is in a downtrend and lost 1.9%.
The USD is in an uptrend and gained 0.8%.
Best wishes to all
Thanks goes to the OEW Group for pulling this together.
We love you Dad.

Cr. to CBZ
LikeLike
Hi
DOW and DJT didn’t make a new high in this uptrend like SP/W5000
I preffer to trust more in DOW/DJT
https://invst.ly/aasag
https://invst.ly/aasbg
https://invst.ly/aas9m
Ciao
LikeLike
Thanks Jungle.
LikeLike
BTC projection : keeping the big picture always in the frame !

LikeLike
first and second frames are line break charts in log scale , third one is regular candle stick chart in linear scale – notice how it becomes easier to identify waves .
LikeLiked by 1 person
Thank you JJ…really nice work…and a good heart.
LikeLike
bitcoin is still straight down
until proven otherwise
LikeLike
above 4600 could signal a halt to the bleeding
LikeLike
instead of condescending you could suggest when to use linear and when log scale.We are all here to share knowledge and ideas 🙂
LikeLike
Just wanted to comment on the posters regarding ‘daytrading’. That’s a fairly nebulous term so let’s not focus on that. My thought is that Tony was generous in sharing his views, and that i try to do the same, as do others. From my perspective, i am not trying to convince you of anything. Phil and Asa do a great job of posting their daily dh/algo/fib views and attempt to sync that with EW/OEW. Since they do that already, my hope is to get people to think about the why and how of what they are doing. Tony was fond of the term ‘trade what’s in front of you’. Taken another way, i say try not to over anticipate. All trading depends on it, but not to the degree that strong uptrend will produce a 60 pt pullback necessarily, for example. I do miss Tony and his kind spirit.
LikeLike
When people on this blog complain about it being overrun by the scalpers/daytraders, they’re referring to the number of posts from the DH traders. When Tony reopened the blog on 7/23/2016, he stated that he only wanted to see a **total** of 30,40, or 50 quality posts per day in the comment section. He stated that he did not want to see 100s of posts every day. He also said that he didn’t want it to be used as a social media app, and he frequently stated that he didn’t want it to be a daytrader’s diary. Well, yesterday, Phil posted 31 times, and Asa posted 16 times. So, just between the 2 of them, they hit Tony’s daily limit for the entire comment section. Nuff said.
LikeLike
Well then 2822-2832 area is the decider. Over 2832 up we go, under 2822. My opinion we head to 2600 area quickly in an ABC fashion. Possibly down to 2700 by Tuesday. Rally on fed Wednesday then reverse down to 2600 by Monday the 25th then off to new highs.
LikeLike
SPX target 2865
https://jobjas.wordpress.com/
LikeLike
exactly !
this is the 3 of 3 of 3 i am looking for jobjas !
we shall soon know
LikeLike
Stuff.
http://www.traderscrossover.com/store/index.php?p=intra
LikeLike
I noticed a complaint about posters not posting charts…well, rather than complain about it…why don’t YOU post a chart!

LikeLike
Rick
dont know if you were following my commentary friday
but this is how i was able to exit longs at 2834 es
similar to your getting short near there
as long as we reach the correct conclusion
its all good
no matter how we get there
LikeLike
also note the bounce from 2823
it was totally expected
does anyone remember what 2823 es was ?
LikeLike
Thanks Phil. So you identified an immediate-term trend change, based on the downward reaction off of your baby bear .618 line at 2834. Short opportunity there = exit longs.
LikeLike
Thanks phil1247 ….. You are very generous & your explaining things to someone else helps others understand better….Really appreciate your time and effort each day!
LikeLike
welcome james and obsessed…..
think of this as a tug of war
a decline starts 25 cents at a time
if it can gain a foothold on 1 minute then 15 min then 1 hour
you may have a downtrend beginning
on the other side you have longs
the extensions show how aggressive buyers are
so now the question is…..
who will gain strength going forward?
on the daily chart
the bulls are in total control
LikeLike
What a nice tradition. A lot of people loved Tony.
LikeLike