
REVIEW
The week started at SPX 2656. After gap up openings on Monday and Tuesday the SPX rallied to 2717 by Wednesday morning. Then over the next two days the SPX came within 5 points of giving it all back when hitting 2661 late Friday, before bouncing to end the week at 2670. For the week the SPX/DOW gained 0.45%, and the NDX/NAZ gained 0.60%. Economic reports for the week were quite positive. On the downtick: the NY FED and the NAHB. On the uptick: retail sales, business inventories, housing starts, building permits, industrial production, the Philly FED, leading indicators, plus weekly jobless claims declined. Next week’s reports will be highlighted by Q1 GDP and housing.
LONG TERM: uptrend
In the early stages of this bull market we suggested it could last 2 – 4 years and travel to SPX 3000+. It has been a bit more than 2 years now, and the high has been SPX 2873. Was that it? Not, according to the counts the have on the major US indices, some foreign indices, and some leading stocks. At minimum we should see another leg up to new highs. But where is it? All the market has produced, for nearly 3 months, is volatility and range bound corrective waves. It looks like it is waiting for a positive catalyst.
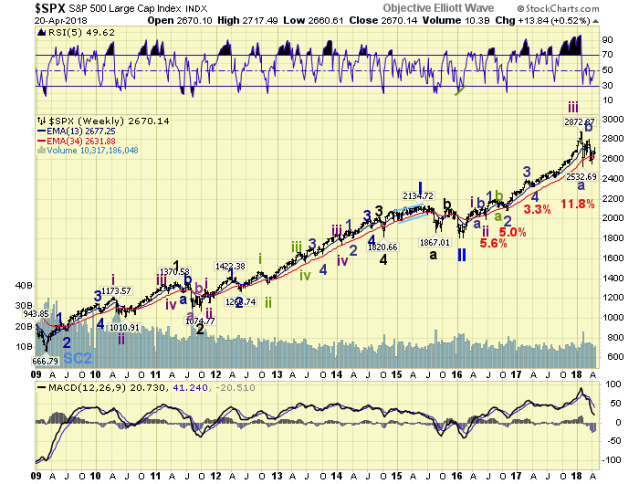
In the meantime the long term wave count continues to unfold as expected. A Major wave 1 bull market dividing in to five Intermediate waves. Intermediate waves i and ii completed in the spring of 2016. Intermediate iii then divided into five Minor waves. Minor waves 1 and 2 completed in the fall of 2016, and Minor waves 3 and 4 completed in the spring of 2017. Recently, in January 2018, Minor wave 5 completed, along with Intermediate wave iii, and an Intermediate wave iv correction began. After this weeks action, it appears it is still underway.
MEDIUM TERM: downtrend
Intermediate wave iv could have completed in February, after a 12% selloff ended with positive RSI divergences everywhere. The market rallied about 10% into March, did not make a new high and then failed. A retest of the low occurred right on the first trading day of April. Again with positive divergences. But the market has again failed to sustain an impulsive rally off those lows.

Some have speculated this correction could be a fourth wave triangle: A 2533, B 2802, C 2554, D 2717?, with E to follow. It could also be a double three: a-b-c zigzag to 2533, x wave to 2802, now another a-b-c (flat or zigzag) underway to retest the lows? Regardless of the final outcome we are still expecting at least one more uptrend, and series of new all-time highs. Medium term support remains at the 2656 and 2632 pivots, with resistance at the 2731 and 2780 pivots.
SHORT TERM
We were tracking the rally from SPX 2554 with a potential impulsive count. We had Minor waves 1 and 2 at SPX 2673 and 2586. Then a Minor 3 underway. Minor 3 divided into three Minutes waves: 2665, 2645, 2717. Then it blew up on Friday, when the market dropped below 2665. Now all we have is a lot of corrective activity from the high at SPX 2672 in early April. This potential uptrend no longer looks to have any chance of being impulsive.

Under the market we can see three potentials levels of medium term support: 2586, 2554, and 2533. Let’s see what the technicals looks like as these levels are hit. Short term support is at the 2656 and 2632 pivots, with resistance at the 2731 and 2780 pivots. Short term momentum ended the week oversold. Best to your trading this volatile market!
FOREIGN MARKETS
Asian markets were mostly higher and gained 0.3%.
European markets were all higher and gained 1.7%.
The DJ World index gained 0.4%, and the NYSE gained 0.5%.
COMMODITIES
Bonds are now in a downtrend and lost 0.8%.
Crude remains in an uptrend and gained 1.5%.
Gold is also in an uptrend but lost 0.7%.
The USD is in an uptrend and gained 0.6%.
NEXT WEEK
Monday: Chicago PMI and existing home sales. Tuesday: Case-Shiller, consumer confidence and new home sales. Thursday: weekly jobless claims, and durable goods. Friday: Q1 GDP (est. 2.1%) and consumer sentiment.

SPX hourly ema 34
http://stockcharts.com/public/1269446/
Never the same but middle of March and April’s price action similar,
3 waves up from today’s low then another hit ?
LikeLike
Are you looking left again?
LikeLike
ES, then up over night to my magnets at 2637.25 and 2642.25
https://gyazo.com/8a6af1e84535acf445581499ca9bce4c
LikeLike
if above 2643
expect squeeze up to 52 to 61
LikeLike
I am thinking just a slight push into the next volume cluster which is at 2642.25, then rejected back down… but will see. but if not rejected, I can see that to 2660
LikeLike
Took a gamble closed when 45 down, reentered when 35 down. All for next week now. All at 254 on SPY.
LikeLike
Is it a fractal of the first down wave or the second, or does it matter??? We aren’t seeing the down volume of the last 2 thats for sure but tomorrow is another day =)
LikeLike
Looking at 3/12 to 3/16 the first 2 waves down were almost identical in length. Who knows if it continues BUT the drop is definitely NOT finished. if similar pattern sill exists expect a one or even two day flat move followed by the largest move yet. Still see 4 or 5 days for first bottom attempt at low 250’s. .
If it’s more like 1/29 drop, different pattern and a more pronounced drop. Expect the 3/13 pattern for now.
Pure speculation if followed any of the last 2 drops.
LikeLike
Looks impulsive to me but I think they keep it in the triangle before a huge B wave then DOWN…
LikeLike
I exited some shorts today just in case and believe it or not Im looking to get long for a while soon…
LikeLike
Just gone long FTSE.. seems like a decent set up for the gap close attempt tomorrow AM. Stop under 7350
LikeLike