
REVIEW
The market started the week at SPX 2164. After a bounce to SPX 2171 on Monday the market pulled back to 2156. On Tuesday the SPX hit 2181, but this was followed by a pullback to 2171 on Wednesday. On Thursday/Friday the SPX made a new uptrend high at 2190, then dipped to end the week at 2182. For the week the SPX/DOW gained 0.45%, and the NDX/NAZ gained 1.40%. Economic reports for the week were mostly positive. On the downtick: import prices, capacity utilization and the WLEI. On the uptick: retail sales, export prices, NY/Philly FED, business inventories, the CPI, housing starts, building permits, the Q4 GDP estimate, plus weekly jobless claims improved. Next week will be highlighted by the FOMC minutes, more housing reports and the Thanksgiving holiday.
LONG TERM: uptrend
Some observations. Since the election the DOW, NAZ, R2K, SOX and TRAN have all made new yearly highs. The DOW and R2K highs were also all time highs. The NDX, NYSE and the SPX have been the laggards. While the NDX and SPX made all time new highs earlier in the year, the NYSE has still not made a higher high than 2015. Neither has any foreign index that we track with the exception of the FTSE. The NYSE continues to act more like an international index, than a US index.
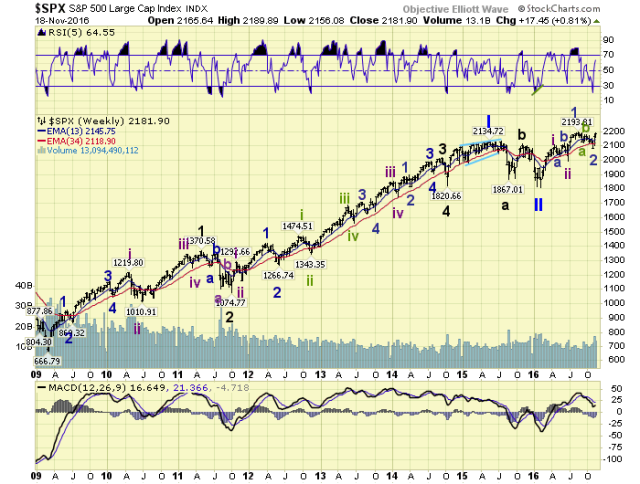
After a long term downtrend low in February 2016, the first since March 2009, the market embarked on a long term uptrend. Since 2011 did not quantify as a long term trend change, and the May 2015 – February 2016 decline was only 16%, we have labeled the long term trends as follows. Primary I May 2015, Primary II February 2016, and Primary III underway. From the February low the SPX has rallied to 2111, did a three wave decline to 1992, rallied to 2194, done another three wave decline to 2084, and is now rallying in a new uptrend.
MEDIUM TERM: uptrend
We labeled the SPX 2111 high Intermediate wave i, and the 1992 low Intermediate wave ii. Then the SPX 2194 high Minor wave 1 of Int. iii, and the 2084 low Minor wave 2. The current uptrend should be Minor wave 3 of Intermediate wave iii. Since Primary waves unfold in five Major waves, you can see we are in the very early stages of Primary III. In fact, only in the subdivisions of Major wave 1.
At the Minor wave 2 low of SPX 2084 the market displayed the usual characteristics of a downtrend low. The daily/weekly RSI were quite oversold, and the hourly RSI had a positive divergence. Since that low the market has rallied 106 points, 5.1%, in just two weeks. And a few of the earlier mentioned indices have done even better: TRAN +9%, SOX +9% and R2K +13%. The recent action certainly looks like the kick off to a third degree wave.
As each new bull market unfolds, and we believe this is a new bull market, it develops its own characteristics. Thus far this bull market has displayed two month uptrends followed by multi-month corrections. As noted last weekend it looks similar to the 1984 period. Since this uptrend began this month we should expect it to last until at least January. Santa rally underway! Also the first two uptrends were 300 and 200 points respectively. This suggests this uptrend should be about 300 points, and reach the SPX 2380’s before it concludes. Medium term support is at the 2177 and 2131 pivots, with resistance at the 2212 and 2270 pivots.
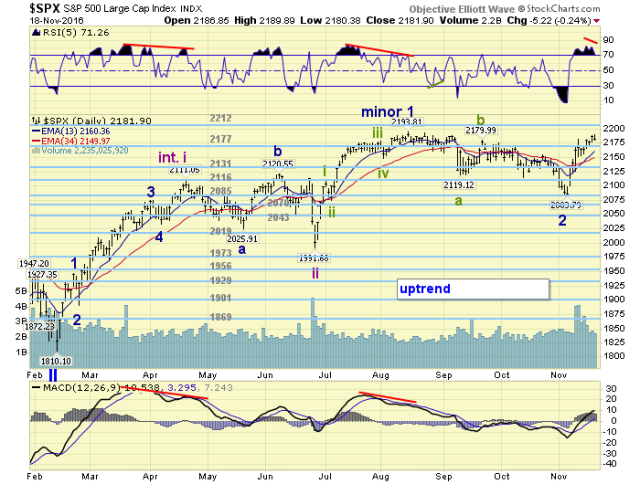
SHORT TERM
Early this week we noticed another short term count unfolding, and it has worked out quite well thus far. From the SPX 2084 downtrend low we counted four waves up: 2147-2125-2182-2152, with a fifth wave underway. The fifth wave was counted as follows: 2171-2156-2181-2172-2190. This entire advance, SPX 2084-2190, is only Minute wave i of Minor wave 3. There will be five Minute waves during this Minor 3 uptrend.

Approaching the high, we noted on Thursday, there were negative divergences on the hourly/daily RSI. This typically occurs during a top of some degree. We also noted, due to the configuration of the waves, there was three resistance levels overhead: SPX 2194, SPX 2200 and SPX 2209. Two levels and then the 2212 pivot range. When the rally does end the pullback could take the SPX back to the 2150’s for Minute wave ii. After that Minute iii should kick in to the upside. Short term support is at the 2177 pivot and SPX 2151, with resistance at SPX 2194, SPX 2200 and the 2212 pivot. Short term momentum ended the week under neutral.
FOREIGN MARKETS
Asian markets were mostly lower but ended the week mixed.
European markets were mixed and ended with a 0.3% loss.
The DJ World index ended the week -0.2%.
COMMODITIES
Bonds continue their downtrend and lost 1.2%.
Crude appears to be uptrending again and gained 6.8%.
Gold continues its downtrend and lost 1.3%.
The USD reached 13 year highs while gaining 2.4% on the week.
NEXT WEEK
Tuesday: existing home sales. Wednesday: weekly jobless claims, durable goods, the FHFA, consumer sentiment, new home sales and the FOMC minutes. Thursday: Thanksgiving holiday. Friday: markets open but closing at 1pm. Happy holidays!

sold half spx 2196
LikeLike
sold all but 20% SPX
boyze may have front run target by 75 cents
LikeLike
LikeLike
If the -divs don’t kick in….the powers that be would have to push the indexes a fair amount higher to negate those divergences.The monthly,I’m guessing…50-60 SPX points?
Wouldn’t put it past them though.They can’t have a -div on the monthly sittIng around can they?The monthly +div last December was what set up this years rally,in theory…so the CBs need to kick it in gear if they want to avoid a similar signal in reverse.10 days to do it.
LikeLike
2196/7 is resistance, but I think we will go through it… to 2203/4…
LikeLike
What is your take on gold here Learned…..my pattern hadn’t broken, but have to go up from here….if not then down where there is a multi-bottom…..your ideas are much more nuanced than mine…
LikeLike
Just holding what I’ve had for a while.Getting above 25.5 on GDX would indicate ANOTHER false breakdown.Not counting on that(23% chance).+weekly div on gold AND GDX.When(if?)that kicks in will be interesting to see how high price gets.Very iffy right now.A breakdown below previous lows is not my preference to see–unless there are more technical divergences.So I wait.
LikeLike
…but GLD could also go to 160, if it doesn’t crash and burn….
LikeLike
http://www.spdrgoldshares.com/
I keep track of GLD tonnage on here.Down to 907 tons.Was 945 last week.Well over 1100 in the summer.Need people to buy physical gold,as it was a key part of the rally.It’s another indicator that’s bearish right now.A reversal would be huuuge.
LikeLike
I bookmarked.
Thanks Learned…don’t let stuff get to you…I am going to start a conspiracy to get GLD up..x
LikeLike
+1 Fiona 😉
LikeLike
For the James Bond fans
LikeLike
S&P 2203…oil up to 60’s
LikeLike
Fiona, do you have alternative to UWTI, since it will be delisted soon?
I sold mine too soon.
LikeLike
UCO long SCO short….do check I have never used them…I have UWTI, but watching timeframe…
LikeLike
Meaning? You will sell UWTI just before December 12… or whatever was the date of delisting?
Not risky to you?
LikeLike
Blue, I seldom hold overnight….I buy and sell all the time….hope you do well.
LikeLike
Blue, take profits when you have them in oil…every profit is a blessing.
Oil is a “deal or no deal” situation, and even experienced oil traders can get caught..
Be careful…
LikeLike
…and then I read your thoughtful reply to Schumann….
Here’s the thing about that Lang Lang video – the connection between the conductor and pianist….they both believed in magic, and that is what happened. x
LikeLike
http://finance.yahoo.com/news/market-calm-back-short-term-134931053.html;_ylc=X1MDMTE5Nzc4NDE4NQRfZXgDMQRfeXJpZAMxa2oxbmRwYzM2ZGs2BGcDZFhWcFpEeHVjejR4Tm1WbFl6TTRZeTB6T0RJNUxUTmtOMkl0T0RabE5DMHpPRFZsTkRabU1HVmxZMlk4Wm1sbGJHUStYblpwZUE9PQRsYW5nA2VuLVVTBG9yaWdfbGFuZwNlbgRvcmlnX3JlZ2lvbgNVUwRwb3MDMARyZWdpb24DVVMEc3ltYm9sA15WSVg-?.tsrc=applewf
LikeLike
Make the jump to Light Speed
LikeLike
/ES
extension long target is near at 2196
raising stops on longs and dumping half if target resists
LikeLike
hourly chart looks like a triangle followed by a wedge
? wave 4 triangle and now ending diagonal wave 5 ?
not hanging around long if thats the case
LikeLike
Hard to count the waves when it’s clearly subdividing. Better to switch to MA breaks to confirm swing shorts.
LikeLike
bada bing
2196 target hit !
LikeLike
/CL
thru 48.15 target
raised stops
added more UCO
LikeLike
looking for exits near 49.37
LikeLike
SP hits a new ATH this morning – albeit by a fraction for now – but a high is a high and technically a bullish development.
LikeLike
People who think this is going on for years will be disappointed. From a short term and intermediate term I always believe it is technical. No if and or buts but when bulls start thinking fundamentals don’t matter at all and its only price it tells me you have no clue. In the very long term it is fundamentals that lead price contrary to your beliefs. I have heard people on here say well the charts say this so it must mean corporate earnings are going to increase significantly. Sorry to disappoint you but you are wrong. The fundamentals will dictate price in the long run and if the fundamentals decline over the next couple years your overly optimistic counts will get changed and then magically you will ay “oh yes the charts really were saying something else we just didn’t have the needed information yet”.
1) Recessions start at full employment
2) Recessions are often induced by a tightening of monetary policy
3) We have distorted yields and risk through unprecedented monetary policy that eclipses all other previous FED intervention ever and we are now unwinding that distortion
4) Higher dollar prices and higher interest rates do not help multinational US firms, the housing market, or the manufacturing sector, or emerging markets
5) Global debt levels are at peak levels and in some key countries at levels that are unsustainable
I haven’t even gone into the Euro region or Ponzi China mind you. Just simply look at cycles and their inevitable link to yields, currencies, rates, inflation, employment, and debt. Sorry perma bulls although the ball is in your court for now for the trend is up this bull market is near its completion and I cant wait for the day that all of you say oh my its over and many can all remind you how you talked about a bull market for years and years and years. I cant believe I’m saying this but Golly is sounding smarter and smarter and smarter these days.
LikeLike
You said the bull market is “NEAR”..the end…..What is your definition of near ?
A day a week a year …..3 years…..? Rather vague for someone who knows whats going to happen.
LikeLike
But the VIX…. JK “fundamentals decline over the next couple years” Why would they decline? We have the business friendly, job creating, uber growth GOP full throttle on deck. The entire ideology and platform is one of growth. There won’t be a way to even check their powers. Majority of states also R Governors. States and Federal in sync. 1T$ stimulus on top of that… I don’t see any reason to think fundamentals and price would diverge. USA!
LikeLike
None of your points have any basis for a terminal point. I was told 5 years ago the debt level was unsustainable then. Interest rates aren’t even where it was 3 or 5 years ago? no way interest rates are yet showing a breakout. the 30 year trend is still down. We hit rock bottom supposedly and any spike higher might seem large but in historic contents it is at very low levels. the pressure from dollar on earnings should be seen. the argument one year ago was that the chart was topping and about to fall over. No many saw the domestic underlying strength until I pointed it out. We see what we want and stop looking.
The market has been very rational over these 7 years and earnings have been stretching but so has the economic engine. A stall here is serious. no sigh of one yet. A squeeze in earnings due to higher costs is a concern. the way companies have managed to keep earnings growth over last 10 to 15 years is also a concern. The one thing going for the market is the deflationary pressure on costs and salaries. If that dynamics changes a deep drop is warranted. no clear evidence yet.
LikeLike
I expect higher costs and tighter financial conditions to occur soon but if it doesn’t I stay with the bull. I never lock myself in. We should know if the double digit profit potential holds come January. For now the odds of market forming a top is small. I expected all along for the economy to pick up and I called the next deep correction based on stretched earnings alone. in fact I suggested the consumer will have the upper hand in 2017 even as the market drops over 25 percent. No end game yet. Can’t push the natural flow of market topping pattern. it doesn’t not look like this is the final wave.
LikeLike
2196 and climbing. A clear breakout pattern that should hold thru end of year. not ruling out corrective moves but it looks to b small in nature. Have not yet reached the top of wave structure. once we do (2220-50?) , then we should see some steeper swings. Holiday rally with a potentially explosive government spending package that should keep the bulls happy this whole year.
LikeLike