
Many are familiar with the original three Dow Jones Averages: Industrials, Transports and Utilities. The mainstream media reports daily on the first two, but hardly pays any attention these days to the latter. In the following paragraphs we will display how what appears to be random growth patterns are actually repetitive growth patterns using OEW.
The Transports. Most are quite familiar with this average as it is quoted every day by the MSM, and we even have its charts included in our stock charts. This is what it looks like over the past 100 years.
![]()
To the untrained eye, after the 1932 crash low, it looks like a major low in 1938, 1970 and 2009. Its three biggest bear markets over the past century. When we apply OEW quantified analysis we see something a bit different, and a series of repetitive patterns. No randomness at all!
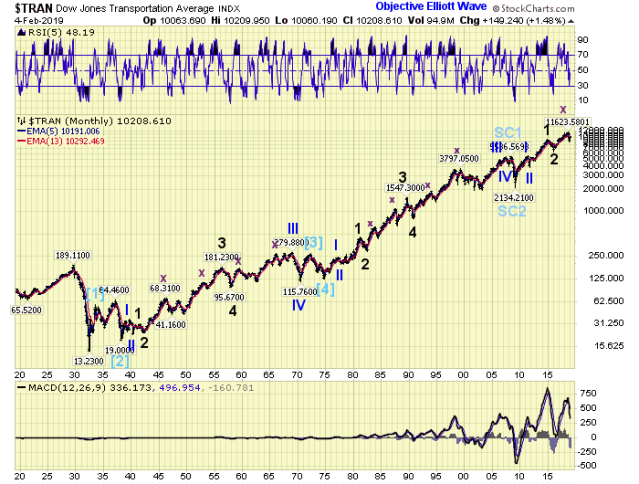
After Cycle waves [1] and [2], 1932-1938, we see a simple P1-P2 (blue), a simple M1-M2 (black), then a five wave (purple) M3, followed by a five wave (purple) M5 to complete P3 (blue). Then Cycles waves [3] and [4] complete in 1973-1974, and the same exact pattern starts all over again. A simple P1-P2, a simple M1-M2, a five wave M3, followed by a five wave M5 to complete P3. SC1 and SC2 then conclude in 2008-2009. Then the same repetitive pattern starts all over again. This suggests Intermediate iii of Major 3 should be underway next.
The Utilities. While neglected these days by the MSM it is still unfolding in its own repetitive pattern. This is what is looks like over the past nearly 100 years.
![]()
Notice it did not end its depression crash until 1942. Then it looks like a major low in 1970, and another major low in 2002. When we apply OEW quantified analysis we see a totally different series of repetitive patterns, unique to this index.

Cycle [1] starts off with a lengthy P1 and P3 (blue), and ends with a five Major wave (black)P5. The after the Cycle [2] low in 1974 the pattern repeats with a slight alternation. Cycle [3] starts with a lengthy P1 (blue), a five Major wave (black) P3, then a simple P5 (blue). Then after the Cycle [4] low, SC 1 high, and SC2 low, the initial pattern (1942-1965) begins to repeat again. This suggests P5 should subdivide into five Major waves next.
If one had this much historical data, and the proper training, one could uncover similar repetitive patterns in any stock index, commodity, currency or stock. Best to your investing.

Excellent analysis Tony, very appreciated.
“History doesn’t repeat itself, but it often rhymes.”
A couple of questions…
1. How does OEW know or quantify the difference between a wave-2 and a wave-4 at various degrees? For example, on the Transportation index, OEW has a wave-2 low (i.e. Major-2 wave) in 2016. But how does OEW know this isn’t actually a wave-4 low (i.e. Primary-iv wave) instead? In a quite a few other related indices, OEW has the 2016 low as a wave-4 pullback.
2. From the 1932 low, the Transporation index started a SuperCycle wave, and completed the first Cycle-1 wave shortly afterwards. From the 2009 low, another new SuperCycle wave has started. If Cycle-1 from 1932 low is considered as a Leading Diagonal, and If Major-1 (2015) and Major-2 (2016) were to be considered as Primary-iii and Primary-iv waves, then Cycle-1 would have completed at the 2018 high. Is this plausible comparison to make, i.e. as follows…?
LikeLike
Tony, I’m confused, you just said what I was proposing (I think!); in regards to the Transportation index…
—1932 started a SuperCycle. The first Cycle-1 wave, consisted of five Primary waves during 1932-1937.
—2009 started a SuperCycle. The first Cycle-1 wave, consisted of five Primary waves during 2009-2018.
If the aforementioned two comparisons are true, then the Transportation index would currently be in Cycle-2 pullback, equivalent to 1938. Could this be a possibility under OEW theory?
LikeLike
SALUTI PADRONE, ANLISI MAGISTRALE .
CIAO
LikeLike
grazie
LikeLike
that is not my chart!
why are you using my logo and modifying my work?
do not ask me any more questions
I maintain three websites, plus teach
I don’t have time for trickery.
LikeLike
Tony! I did NOT intend any trickery!
I simply modified your chart to express my inquiry. In my post I stated two modifications, and provided a modified OEW Transportation chart to visualize the modifications —not under trickery, but explicitly and intentionally to assist the question.
—Modification 1: Cycle-1 from 1932 low considered as a Leading Diagonal, consisting of five Primary waves from 1932-1937.
—Modification 2: Major-1 (2015) and Major-2 (2016) considered as Primary-iii and Primary-iv waves, then Cycle-1 would have completed from 2009-2018.
All I wanted to convey was that if these modifications were permissible under OEW theory, as per the modified chart, then the start of both SuperCycle waves, i.e. from 1932 and 2009 would be very similar, and that now Cycle-2 pullback would now by underway from the 2018 high.
Anyway, no need to respond, but just wanted to clarify, apologies for the confusion! 😉
LikeLike
Was that you Lee?
CNBC just reported the most expensive home in Miami just sold for $50mil.
Did you cash in your CL longs? =)
LikeLike
Yep !
I’ll miss that place , especially the dance floor !
LikeLike