
REVIEW
Another good week for the market as new all time highs keep this uptrend rising. The market started the week at SPX 2040, rose to 2056 by Tuesday, pulled back to 2040 by Thursday, then rallied to 2071 on Friday. For the week the SPX/DOW were +1.10%, the NDX/NAZ were +0.55%, and the DJ World gained 0.90%. On the economic front it was a positive week. On the uptick: NY/Philly FED, the PPI, NAHB, building permits, existing home sales, leading indicators and the WLEI. On the downtick: industrial production, capacity utilization, housing starts, plus weekly jobless claims rose. Next week, a holiday shortened one, we get Q3 GDP, the Chicago PMI and reports on Housing.
LONG TERM: bull market
The March 2009, Cycle wave [1], five Primary wave bull market continues. Surprisingly this market has already reached a level 31% above the previous all time high in 2007. And, it is the third longest bull market, in months, in the modern era. Only the 1921-1929 and 1987-2000 bull markets had a longer duration. What is also surprising, is that it has been three weeks since the FED ended QE 3 and the market is still rising. This has not occurred before in the entire bull market. Certainly there is a lot of QE-like activity in other countries, but nothing underway or promised by the FED. In fact, many are honing in at the beginning of short term rate increases starting in June 2015.

We continue to count Primary waves I and II ending in 2011, and Primary wave III underway since then. Twice, when this market looked like it was about to end Primary III, Q3 2013 and Q3 2014, it extended. You will note in the SPX/DOW/NDX charts, we have upgraded all those charts to an extending Primary III. The NAZ chart is now the only one of the four with the alternate Primary IV: Major A – B count. We have slightly preferred the extending Primary III count for a few weeks now. After tracking this uptrend for five weeks, we do not currently see any signs that it is a corrective B wave. It looks quite impulsive.
MEDIUM TERM: uptrend
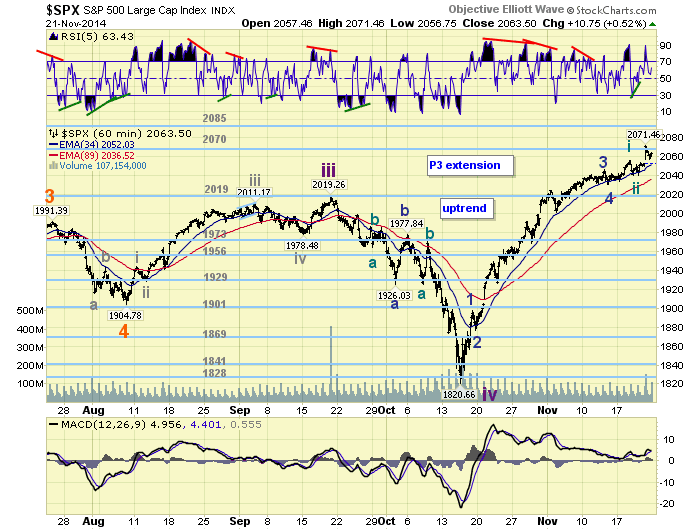
This uptrend began in mid-October at SPX 1821. It made quite an explosive advance into early November, and since then has slowed somewhat. In the beginning there were many small degree waves, as the uptrend tried to establish itself. We had a difficult time trying to count all these smaller waves, and decided to just let the uptrend unfold. This is quite unusual. Nevertheless, the market finally settled and we were able to get a decent count. Since then we have been counting five Minor waves up from the SPX 1821 low: 1898-1878-2046-2030-2071.

Once this uptrend cleared the 2019 pivot we expected it to continue until the 2070 pivot, and possibly the 2085 pivot. This market hit the 2070 pivot on Friday. Around these pivots we have a cluster of Fibonacci wave relationships, which should act as resistance: 2078, 2082 and 2084. This small six point range locks in the entire advance from the SPX 1075 Primary II low, making it quite important. Should this uptrend break through it, and the pivots, the next pivot is at SPX 2131. Technically, we are still observing negative divergences on the daily NDX/NAZ charts, and now the SPX chart. This, in itself, is a bit of a warning medium term. Medium term support remains at the 2019 and 1973 pivots, with resistance at the 2070 and 2085 pivots.
SHORT TERM
As noted above we see five Minor waves up from the SPX 1821 low: 1898-1878-2046-2030-2071. Minor wave 3 divided into five Minute waves: 2024-2001-2041-2032-2046, and Minor wave 5 appears to be doing something similar: 2056-2040-2071 so far. With Minor wave 3 more than twice Minor 1, and this uptrend having gained nearly 14% in just five weeks, Minor 5 could be quite small. In fact at SPX 2078 Minor 5 would equal 0.618 Minor 1. Since it has already reached SPX 2071 it may unfold in five small waves or even a diagonal triangle. Interesting juncture medium term.
Short term support is at SPX 2040 and the 2019 pivot, with resistance at the 2070 and 2085 pivots. SPX 2040 now looks like a quite important level for this uptrend. Short term momentum ended the week near neutral.
FOREIGN MARKETS
The Asian markets were mixed on the week losing 0.2%.
The European markets were all higher on the week surging 4.6%.
The Commodity equity group were all higher as well gaining 3.9%.
The DJ World index gained 0.9%.
COMMODITIES
Bonds still look like they are in a downtrend finishing flat on the week.
Crude is still in a downtrend but gained 0.8% on the week.
Gold is also in a downtrend but gained 0.8% too.
The USD continues its relentless uptrend gaining 0.9% on the week.
NEXT WEEK
Tuesday: Q3 GDP (est. +3.2%), Case-Shiller, the FHFA index and Consumer confidence. Wednesday: weekly Jobless claims, Durable goods, Personal income/spending, PCE prices, the Chicago PMI, Consumer sentiment, New/Pending home sales. Quite a busy two days. Thursday is a national holiday: Thanksgiving! Happy Thanksgiving, and best to your short trading week!
CHARTS: http://stockcharts.com/public/1269446/tenpp
GUIDELINES: https://caldaro.wordpress.com/2014/11/01/guidelines-how-to-use-this-site/

Imanewbie… you crack me up; thanks for the laughs! The inane Chicken Little act, “Gap down, flash crash…” is great vaudeville!
Absent a basis in your analysis (no charts, sentiment readings, levels, fundies, etc. — just “feelings”), it *is* like a broken Yoko Ono record.
Are you paid by hedgies to troll blogs and sow seeds paralleling your fund’s positions? If so, at least add some credible content to be more convincing.
LikeLike
Perv,
lol. I’m glad I’m amusing you, your welcome send all donations to charity and please don’t lie on your taxes. I do share my counts, I will share it with you. I think we are now or within 20points from a drop to either 1990 or 1940 depending… I am not a troll, I am your saving grace and apparently many peoples punching bag , and apparently a comedian. No reason to be long here, SPX is extremely overbought with negative divergence… Bullish Sentiment at 49%
http://www.aaii.com/sentimentsurvey?adv=yes
LikeLike
LikeLike
The issue here is everyone and there mother is waiting to sell with a close stop or waiting to go short when a pull back begins. The market is allowing neither, so how do you think it plays out from here? Slow grind up to keep bulls in but even grinding up to a certain point will lead to selling.The writing is on the wall for a good sell off but it cant happen unless its a flash crash or monster gap down over night? Is Ferguson verdict the catalyst/excuse?
LikeLike
LikeLike
Lunker, you sound like a broken record just like me. We just repeat different things, I talk about doomsday over and over and you talk about posting infractions over and over. Are you sergeant blog police or lieutenant?
LikeLike
count for die hard optimists
LikeLike
With the seasonality of this week, the only thing negative could be any event risk out of Ferguson MO. Looks like it will be released today.
LikeLike
The complacency around here is at unprecedented levels…I seriously don’t know how some of you sleep at night, I know many here have been trained to buy the dip and are truly convinced the federal reserve is going to back stop the market no matter what etc. but geez guys.. I mean look at the headlines, lol.
http://www.cnbc.com/id/102211966?trknav=homestack:topnews:19
LikeLike
Well for now the direction is up when that reverses opportunity will be present to get on the right side.
LikeLike
Ferguson MO is already priced in, just like any other bad news 🙂
LikeLike
Interesting article suggests Fed balance sheet continues to expand despite official end of QE. I don’t know if this is due temporary factors or a more deliberate action but could explain how markets are continuing higher without QE liquidity.
Hope link posts okay http://streettalklive.com/index.php/blog.html?id=2511
LikeLike
balance sheet is decline
http://research.stlouisfed.org/fred2/series/BASE
dis-information is in an uptrend
LikeLike
Okay and hear you on the uptrend point 😃
LikeLike
Okay thanks and I hear you on the uptrend point 😃
LikeLike
This market is all Forked up……..A possibility with a CIT tomorrow
http://screencast.com/t/n3GJLq55qSJ
LikeLike
Scotty can I use that fork for my Turkey Thursday and get good use of it…haha just a little humor
LikeLike
What ever happened to the previous 2 CITs? are they void now?
LikeLike
steep trends tend to trample astro and CIT’s………….the steeper the trend the less likely they work
LikeLike
Thanks Tony
SPY ~ WPP @ 206.06 ~ WR1 @ 207.66 ~ WR2 @ 208.65
Friday’s H/L 161.8% ext. @ 208.80
GL & Happy Holidays.
LikeLike
Thanks GT! Seems the market has ended at almost the WR4 the past 2 weeks?
LikeLike
Thx animal.
The range widened this week. May only get to the WR2, with the Fib confluence near 208, and the -/div’s building.
LikeLike
I have to say how many people would be shocked by a spike in the VIX and a nasty reversal down today on the markets? Lets hope central banks are not sleeping.
LikeLike
Some might say looking at the daily charts that we are a tad overbought. Many investors/traders have probably trimmed some risk at these levels.
LikeLike
Money never sleeps
LikeLike
nope printing presses running day and night. they must by the nasdaq and s&p
LikeLike
IMVHO EW/OEW etc would have more credibility if the practitioners did NOT always have an alternate count. Put your chips down and then when it looks like it failed. move to a new squiggle count. However having multiple different counts is a cop out. Would you keep going to a doctor who gave a dozen diagnoses every visit and never stuck to one?
LikeLike
Agree a bit, but that is part of playing probabilities. The true weakness every EW or marketing timing blog/service has is that they give out a price target. Once this target price/top/bottom is printed, any number of forces can work against that forecast from becoming reality. I follow some paid services that have simple long, short or cash recommendations that are protected from this. They work and they work well.
LikeLike
Fishonhook,
If you are going to use EW/OEW you have to find a way to fit it to your overall strategy, or don’t use it. It is just one tool in the tool box. You have to buy low and trim some leveraged risk into a third wave or fifth wave, use low stops for the long run, etc. I cannot trade EW and I say that all the time to people. But if you bought the 2011 and/or 2012 lows and used low stops, recognized the two or three 1-2’s and two or three 3-4’s you could of made a lot of money. I also use monthly and quarterly spy call options from channel lows. Tops are hard to see, so I don’t outright short, maybe hedge 40 to 50%.
If you keep on hoping to trade every wave you will get discouraged with EW. Happy investing.
LikeLike