
REVIEW
The week started at SPX 2295. After a gap down opening Monday the market traded down to SPX 2267 on Tuesday. Then Wednesday’s opening was a gap up, followed by a pullback, then another gap up opening on Friday ending the week at SPX 2297. For the week the SPX/DOW were mixed, and the NDX/NAZ were mixed as well. Economic reports for the week were again mostly positive. On the downtick: the Chicago PMI, consumer confidence, construction spending, auto sales, ISM services, the WLEI, plus the unemployment rate rose. On the uptick: personal income/spending, the PCE, pending home sales, Case-Shiller, the ADP, the ISM, NF Payrolls, factory orders, the Q1 GDP estimate, plus weekly jobless claims were lower. Next week’s reports will be highlighted by the trade balance, the budget deficit and export/import prices. Best to your week!
LONG TERM: uptrend
The Primary wave III bull market continues to unfold, but has spent the most part of the last two months trading above and below the OEW 2270 and 2286 pivots. For the year, which is about 5 weeks old, the SPX is up 2.6%. The wave pattern/labeling we have been tracking remains unchanged.

Since we are expecting a relatively long Major wave 1 of Primary III, we started the first waves with an Intermediate labeling i and ii. The second set of waves is a subdivision of Intermediate wave iii: Minor waves 1 and 2. From the Minor 2 low in early November, just before the election, we have been expecting a Minor wave 3 to unfold. Thus far it still looks too short to be all of Minor 3, as it is barely longer than the previous Minor 1 uptrend (216 pts. v 202 pts.). In the meantime while the market sorts itself out there are a couple of more important points that should be noted.
Should the market enter a correction soon we are likely to see only a 5% decline. Should the market clear SPX 2336, the last potential B wave count, then we can expect 1 – 3 years of bull market activity with the SPX reaching 3000+. Should the market drop below SPX 2084, then the B wave has topped and we are likely in a C wave bear market.
MEDIUM TERM: uptrend
The current uptrend began in early November at SPX 2084. The uptrend has risen for 2 months, which has been the characteristic of the previous impulse uptrends for this bull market. Any new high in the month of February would immediately suggest this uptrend is extending in time and price.
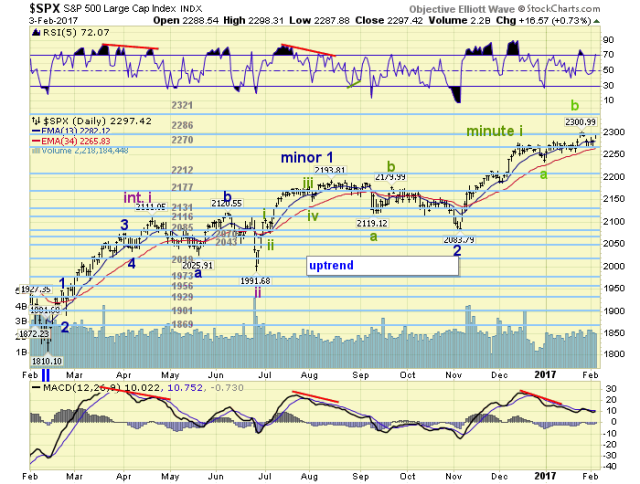
After tracking several potential variations of the short term waves of this uptrend, we settled on two potential counts. The count posted on the chart above suggests only Minute i of Minor 3 completed at SPX 2279, and since then the market has been in an irregular Minute ii correction. This count would require a decline to at least SPX 2234, possibly lower, before ending the correction.

The second count is posted on the DOW charts as noted above. This count suggests Minute i ended at around the same area as the SPX, but Minute ii ended in mid-January. And, the market is currently working its way higher in a Minute iii rally. Thus far it has not been acting like a third wave, and will need to clear SPX 2305 to look more positive. Medium term support is at the 2286 and 2270 pivots, with resistance at the 2321 and 2336 pivots.
SHORT TERM
The five waves up from the SPX 2084 early-November low on both the SPX and DOW counts looks quite clear. The question that is intriguing most is what has transpired since then. Is the market preparing to break out or break down?

The irregular B count in green suggests the rally has probably topped, or soon will top below SPX 2305, before declining in a small c wave to SPX 2234 or lower. The count posted in orange, which looks more like the count posted on the DOW charts, suggests Minute iii is currently underway and has already completed two smaller Micro waves 1 and 2. The five wave advance for Minute i from SPX 2084-2279 was also five Micro waves. SPX 2305 and SPX 2267 are the key levels for both counts. A drop below SPX 2267 and a correction is likely underway. A breakout above SPX 2305 and the uptrend is extending.
Short term support is at the 2286 and 2270 pivots, with resistance at SPX 2301 and the 2321 pivot. Short term momentum ended the week overbought with a slight negative divergence. However, the market needs to decline at least 5 points to put the divergence in play. Best to your trading!
FOREIGN MARKETS
Asian markets were mostly lower on the week for a net loss of 0.8%.
European markets were also mostly lower and lost 0.6%.
The DJ World index gained 0.2%, and the NYSE gained 0.2% as well.
COMMODITIES
Bonds are in an uptrend and gained 0.1% on the week.
Crude appears to be in an uptrend and gained 1.2% on the week.
Gold is in an uptrend as well and gained 2.7% on the week.
The USD is in a downtrend and lost 0.8% on the week.
NEXT WEEK
Tuesday: trade deficit and consumer credit. Thursday: weekly jobless claims and wholesale inventories. Friday: export/import prices, consumer sentiment and the budget deficit. Saturday: a speech from vice chair Fischer in the UK.

Well done here all the Gold traders who caught the recent rally.
LikeLike
Agree 🙂
On the serious note – looks like gold is resuming long term uptrend. Be careful out there.
LikeLike
yep starting to look bullish but still beneath the 200 dma
LikeLike
test
LikeLike
Thanks Tony
SPY ~ > WPP @ 228.40 Swing Long
GC ~ Failure or Breakout at Red Resistance Zone
https://www.tradingview.com/x/WHkvzI5t/
GL All
LikeLike
GT, SPY didn’t make an higher high on the day, it will break support. No swing long.
LikeLike
GTO – nice chart. I hope for the 1210-125 retracement, just could not resist locking profits today. Thanks!
LikeLiked by 1 person
bada bing
1237
target hit !
LikeLike
1241 is next
but im not holding overnite
LikeLike
–Phil1247–

I am aware you’re looking to position into strength for the “Big Short” in Bonds. This chart suggests the coming bear closing rally will be sharp and long, which will be just perfect for us to short into. 🙂
LikeLike
freddie
im not sure if the initial impulse down is complete in bonds / TLT
this is prob a 4th wave
a sharp spike down in bonds would set the stage for the coming rally
maybe 130 TLT
then collapse down to 88
LikeLike
Ok- thnx.
LikeLike
/gc 1237 is next target
new extension longs
upside acceleration
LikeLike
GDX hit target 25.17
profits taken now
LikeLike
still holding GLD
LikeLike
GLD should head back down to 115 from here. I’m out for now, gold needs a pullback.
LikeLike
k
prob right …im selling gld on next spike up
LikeLike
stop is 117.54 in case it goes crazy to upside in last 40 min
LikeLike
I hate those spikes – feel like an idiot selling NUGT at 12.62 and its now over 13. Well, there is always another trade.
LikeLike
nice work phil, GC +55$ from the fibs. I did ok, Still smiling. FIBcontrol™

LikeLike
good work HD
soon gold will get easier once dollar cycles peak
today is dollar cycle low short term
but the larger cycles are all pointing down
LikeLike
I haven’t even looked at the dollar this year. I prolly just got lucky with some fibs.
LikeLike