
REVIEW
The wild and volatile week we expected was nearly all to the upside. The market started the week unchanged, completed its 1.5 week pullback on Tuesday, then made new highs on Thursday and Friday. For the week the SPX/DOW were +1.5%, the NDX/NAZ were +0.5%, and the DJ World index rose 0.3%. Economic reports for the week were mixed. On the uptick: NY FED, NAHB, leading indicators, WLEI, monetary base, and weekly jobless claims improved. On the downtick: industrial production, capacity utilization, CPI, housing starts, building permits and the Philly FED. Next week we get more reports on Housing, Durable goods orders, and Q2 GDP.
LONG TERM: bull market
This week the FED announced they will be ending QE 3 in October, and the ECB had a somewhat disappointing TLTRO 1. Nevertheless US and European markets reacted well to both events. The count we have been carrying on the SPX remains as posted. Primary waves I and II, of an expected five primary wave bull market, ended in 2011. Primary wave III has been underway since then. Primary wave I divided into five Major waves with a subdividing Major wave 1. Primary III has also divided into five Major waves, but this time Major waves 3 and 5 have subdivided.

The SPX count suggests the market is currently in Intermediate wave v of Major 5. The last uptrend of Primary III. The recent underperformance of the R2K and the NYAD suggest this uptrend is indeed a fifth wave. Should this count work out to be the market’s count, then Primary IV would begin when this uptrend ends. Primary II lasted about five months, and the market lost 22% of it value. Primary IV should be a similar 3-5 month decline, while the market loses about 15%-20% of its value. The key level to watch is SPX 1905. Should the market decline to this level at any time in the near future Primary IV is underway.
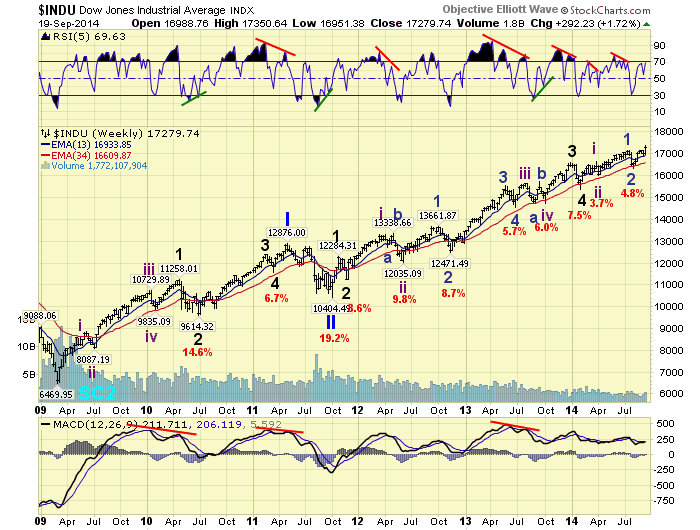
Due to the odd pattern in the DOW, and the smaller than expected recent correction in the NDX/NAZ, we are carrying another count on the DOW charts. This counts suggests that the last uptrend high and downtrend low were of one lesser degree: Minor waves 1 and 2. Not Intermediate waves iii and iv. Under this count Intermediate wave iii would be extending, just like the Intermediate wave iii during Major 3. The key level to watch for this count is SPX 1991. After this uptrend completes, and the next downtrend begins, if the market drops below SPX 1991 the extension is invalidated. If one is adept at Elliott Wave they will now realize, any future downtrend that drops below SPX 1991, or is confirmed below 1991, suggests Primary IV is underway.
MEDIUM TERM: uptrend
The current uptrend started at SPX 1905 in early August. After it completed five waves up to SPX 2011 in early September, we expected a pullback into the 1973 or 1956 pivot ranges. That pullback completed at the open on Tuesday when the SPX traded at 1979. When the market made new highs on Thursday we updated the count to display the first five waves up only completed Minor wave 1 of the uptrend. Minor wave 2 ended at SPX 1979. Minor wave 3 is currently underway.

This uptrend should complete five Minor waves before we should look for an uptrend high. Typically third waves get quite overbought on the daily RSI, and MACD before they begin to top. Thus far we have only observed a 40 point rally off the recent Minor 2 low at SPX 1979. During this rally the RSI has just reached overbought, and the MACD is just beginning to turn higher.
When this uptrend began we gave a minimum target of the OEW 2019 pivot, which was reached on Friday. Our expected target was the OEW 2070 pivot, which we have been expecting for over a year heading into the timeframe. We would now like to add one more pivot at SPX 2085. Since these last two pivots nearly overlap there should be significant resistance once the SPX reaches their pivot ranges. Medium term support is at the 1973 and 1956 pivots, with resistance at the 2019 and 2073 pivots.
SHORT TERM
From the early August downtrend low at SPX 1905 we counted five waves up to SPX 2011. Waves 1 and 2 at 1945 and 1928. Wave 3 subdivided into five waves: 1964-1942-1995-1985-2005. Wave 4 was a simple decline to SPX 1991. Then wave 5 unfolded in a diagonal triangle: 2006-1995-2009-1998-2011. After that we got a somewhat complex zigzag. After a simple Wave A to SPX 1990, and wave B to SPX 2008, wave C got complex. Wave a of C declined: 1991-2000-1983; wave b of C rose: 1997-1986-1998; wave c of C declined: 1978-1987-1979. This pullback completed at the open on Tuesday.
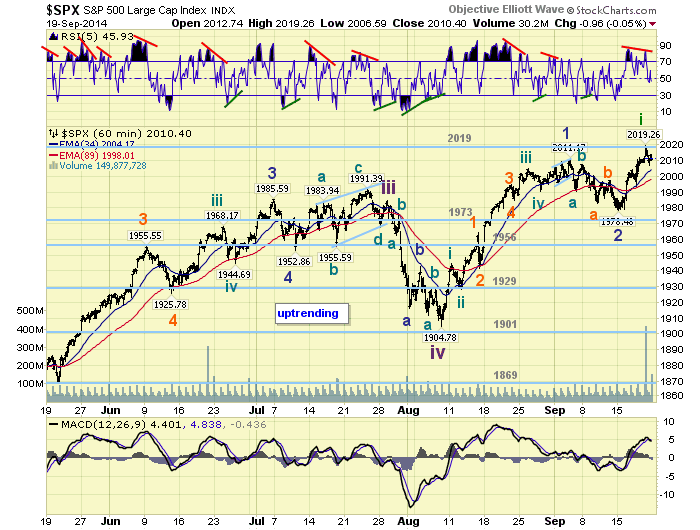
From that SPX 1979 low the market rallied quite nicely to 2004 on Wednesday, and then had a series of reversals right after the FED released their FOMC statement. Since none of these swings actually registered quantitatively, we are considering them just post-FOMC noise. The market then gapped up on Thursday and Friday, hitting SPX 2019, and then had its first quantitative pullback since the low. Therefore, we are counting the entire rally from SPX 1979 to 2019 as one wave, potentially Minute i, and Friday’s pullback to 2007 as likely the major part of Minute ii. If Minute wave i is not subdividing, as we expect, the market should pullback a bit further Monday to end Minute ii. Then a rising Minute iii should be underway. Oddly, Minute i of Minor 1 was 40 points (1905-1945), and Minute i of Minor 3 appears to be 40 points (1979-2019). Short term support is at SPX 2000 and SPX 1993, with resistance at the 2019 and 2070 pivots. Short term momentum ended the week at neutral.
FOREIGN MARKETS
The Asian markets ended the week mixed with a net gain of 0.1%.
The European markets were mostly higher gaining 0.4%.
The Commodity equity group was mostly lower losing 0.9%.
The DJ World index gained 0.3%.
COMMODITIES
Bonds continue to downtrend but ended about even on the week.
Crude remains in a downtrend losing 0.5% on the week.
Gold is also in a downtrend losing 1.2% on the week.
The USD continues its strong uptrend gaining 0.7% on the week.
NEXT WEEK
Monday: Existing home sales at 10am. Tuesday: the FHFA housing index, then FED governor Powell gives at speech at 9:20am. Wednesday: New home sales. Thursday: weekly Jobless claims and Durable goods orders. Friday: Q2 GDP (est. +4.6%) and Consumer sentiment. Would be quite impressed if GDP is actually reported that high. Best to your weekend and week!

Dow EMAs 17126/7
LikeLike
When even the G 20 is clueless, is that a moment of ZEN and ZERO-gravity ?
LikeLike
1994.06 fib , huh? la de da
LikeLike
NYA telling a different story, traded below last weeks low, still in minor 2? Nice abc? With minte a last week’s low, minute b last week’s high and now in minute c?
LikeLike
NYA testing its consolidation lows as support. A close in the lower half of today’s range would put NYA on watch for a Big Up set up day tomorrow (not to be confused with a trigger day). I am flat index futures right now (but I am long DIA calls, which would benefit from a rising Dow, and eventually expire worthless if the Dow continues its decline for an appreciable period.
LikeLike
hi CN. I agree. Take also a look at the bollinger bands on the daily for the SPX: very, very tight. something BIG is about to happen IMHO. Preferred count has that as UP (3rd wave!?!?)
LikeLike
A solid gap and go on heavy volume and a small bounce so far on vapors…bias is still short this week.
LikeLike
Can’t be a minor 2 below last weeks 1 low in NYA although todays low is so close (call it a tie). Pretty bearish daily bar…I would not want to be long here. My definition of a rally failure.
LikeLike
than last week’s high was not a i, but a b-wave high on the NYA.
LikeLike
Hi Soul,
Isn’t the tightness of BB already squeeze SPX to down today?
LikeLike
Hi Amy, the bollinger bands don’t squeeze the price, they are just the 2 standard devations of the price action over the past 20 days. In other words, the BB’s follow the price action, price is not dictated by the BBs.
LikeLike