
Weekend Report
Provided by the OEW Group
December 14, 2019
SPX closed Dec. 6 at 3146 after a weekly high at 3151. This week opened unchanged, but then drifted lower in front of the Wednesday Fed meeting. Tuesday and Wednesday ranged between 3127 and 3143 before exploding higher on Thursday’s open in reaction to renewed US-China trade optimism. After reaching a new all-time high at 3176, profit-taking and nervousness dropped the market back to retest old high 3151 before bouncing once again. Trade talks, UK elections and impeachment proceedings generated volatile action that carried the market to a new all-time high at 3182 on the Friday open before finishing the week at 3169.
For the week, SPX/DOW gained 0.73/0.43%, while NDX/NAZ gained 1.08/0.91%
No big surprises on the economic front. As expected, the FOMC maintained the federal funds rate at 1.5-1.75%. The real news came during the press conference, when FED Chair Powell signaled to keep rates unchanged in 2020 even if the 2% inflation target should be met or slightly exceeded for a short period of time.
Most economic reports were stable or moderately to the upside: NFIB Small Business Optimism Index (104.7 vs 102.4); CPI (0.3% vs 0.4%), up 2.1% YoY, and core CPI (0.2%) in line with expectations; PPI unchanged; import prices up 0.2%, but down 1.3% YoY, and business inventories increased 0.2% in October vs -0.1% in September. Weekly jobless claims though, rose to 252k from 203k last week, and retail sales declined slightly to 0.2% vs 0.3% last month.
The slow but steady improvement of the economy is reflected by the WLEI Index, which has been rising for a while and made a yearly high last week at 2.4%. It is now at 2.2%.

Next week’s reports are: Empire State Manufacturing Survey, Housing Market Index, housing starts, industrial production, capacity utilization, JOLTS, weekly jobless claims, Philadelphia FED Business Outlook, leading indicators, existing home sales, GDP, Michigan Consumer Sentiment, corporate profits, personal income, consumer spending and Kansas City Manufacturing Index.
SECULAR CYCLES: Revisiting 100-years of OEW by Tony Caldaro
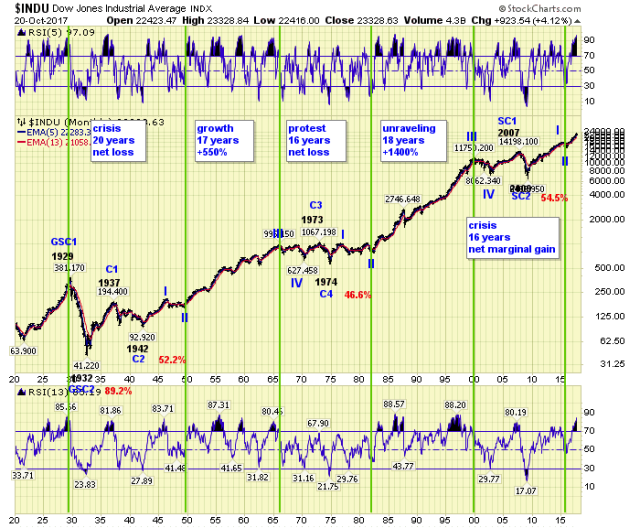
A classic chart, just as a great painting, will stand the test of time. Such is the case with the 100-year DOW chart Tony Caldaro posted here on the public blog on October 21, 2017. The chart reveals, like any masterpiece, many levels of information. Primarily, it shows his Objective Elliott Wave count for over 100 years of stock market price and time. Second, it identifies a Saeculum. A Saeculum is a long-term cycle that has existed throughout history. It lasts on average about 75-80 years and consists of four phases or turnings, each one about 15-20 years. Notice these secular cycles have averaged about 17 years each going back to a Grand Super Cycle top in 1929. All bull and bear market cycles within these secular periods have been fully quantified by objective analytic methods, with no exceptions. This is the essence of OEW. For simplicity of presentation, the chart summarizes bull and bear cycles down to Primary scale only.
Tony was both, knowledgeable about the Saeculum and had his own method of analyzing the stock market, which he coined Objective Elliott Wave (OEW). One of Tony’s master strokes was to identify the turnings of the Saeculum using the stock market via his OEW approach. His conclusion was that in February of 2016 the stock market made a Primary wave II low at SPX 1810, which he also identified to be an inflection point and the beginning of the next turning in the Saeculum. Tony unified the Saeculum and the stock market via OEW. Thus, in 2017 when most believed the economy and stock market were late cycle, Tony forecasted the stock market was just beginning an OEW Primary III wave which should last about 17 years (the length of the previous OEW Primary III wave) and coincide with a Saeculum growth cycle. It is a chart and forecast that has survived the test of time. At OEW we continue to monitor and hopefully build on the work of Tony Caldaro. We have recently observed that the previous Primary III wave, which began in 1982, was about 25 years after the Baby Boom birth rate high of 1957. The next cycle, suggest the current OEW Primary III wave began in 2016 about 25 years after the Millennial peak birth rate of 1989.
What does all this mean? If our beloved maestro’s thesis is correct, and we think it is, then it projects DOW 100K by 2032/33.
The link to Tony’s original Weekend Report post, you will find below.
https://caldaro.wordpress.com/2017/10/21/weekend-update-627/
LONG TERM: Uptrend extension continues
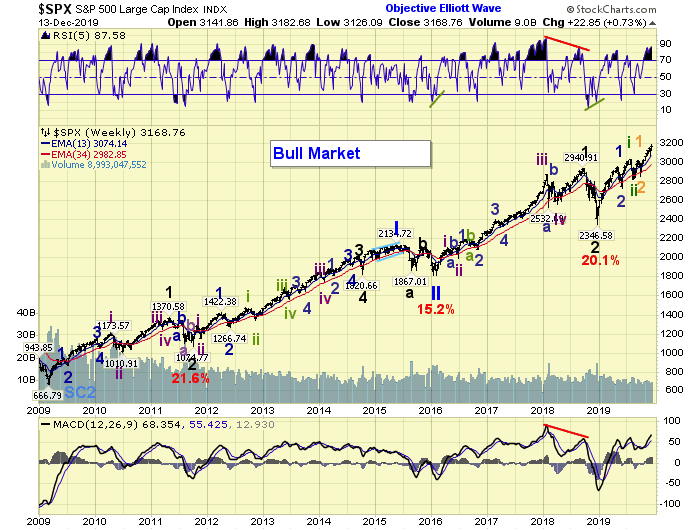
In the US, the long-term count remains unchanged with the Super Cycle SC2 low in March 2009. Primary I concluded in mid-2015 with Primary II concluding in early 2016. Primary wave III has been underway since February 2016 with the Major wave 1 high occurring in October 2018 and Major 2 bottoming in December 2018. Our preferred long-term count is posted on the SPX Weekly chart, which reflects that Intermediate wave i of Major wave 3 is underway and continues to subdivide into Minor, Minute and now Micro waves. A breakout above the September Micro 1 high at 3020 has occurred, ushering in a series of potential wave 3 moves higher. However, we’re still waiting to see if the current trend continues to make new highs, rising enough to not overlap the previous uptrend high, during the next downtrend. We maintain our bearish alternate count as posted on DOW in the public chart list, though its probability continues to drop as the market goes higher.
MEDIUM TERM: Uptrend testing possible extension
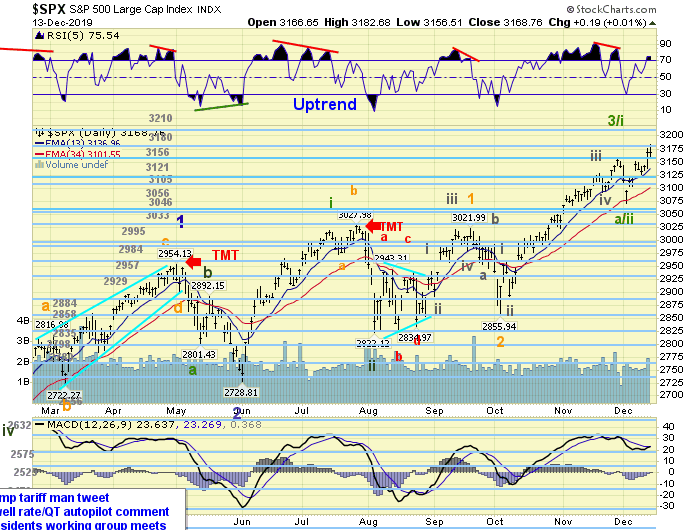
SPX continued to rally off the previous week’s low and achieved another all-time high at 3183 by early Friday morning. Our 3180 pivot became both a magnet and stop sign for the price action the week. This gives the second largest rally for this uptrend of 113 points, without a meaningful pullback. We can now count seven qualified subdivisions from the downtrend low at 2856. This latest rally puts pressure on a potential breakout of the inflection point mentioned last week. We’re still waiting for a break above 3200 to signal an extension of this uptrend. Until then, our wave status remains unchanged. Some in our group have suggested an alternate analysis such that Nano wave iv (as shown) was too small to be considered and should be replaced with Nano wave iv at 3070. This different view suggests the uptrend may be working on the fifth significant wave up off the low. There’s some merit to this idea as the NAZ may be signaling a similar characteristic, however we’re sticking with our existing metrics until further wave action clears up the picture. SOX reversed this week to a new uptrend while TRAN remains in a confirmed downtrend, another sign the trend may be strengthening. Either way, our target for Minute wave iii remains unchanged at 3300 by early next year.
SHORT TERM:
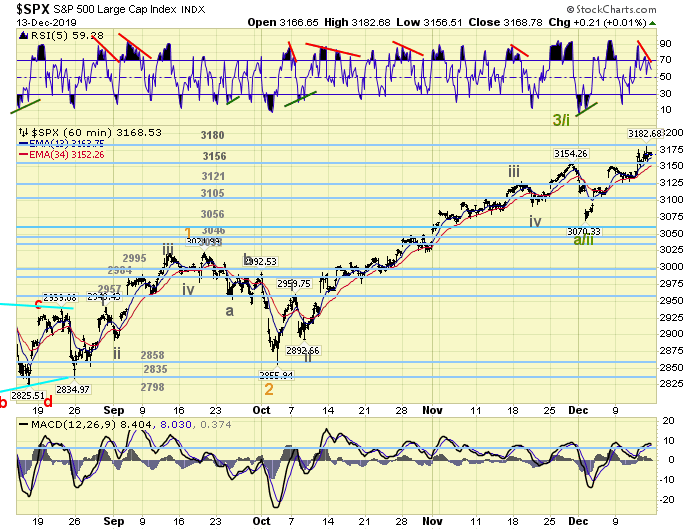
Our short term count continues to align with the medium term subdivisions. We can count five qualified waves up from 2856 to 3154 with a large third wave, which gives a nice impulsive structure to that point. From there, we have two more waves, 84 points down 3070, followed by 113 points back up to 3183. It’s unclear whether the recent rally is Nano wave b of an ongoing Micro wave 4 or the beginning of a third wave extension. Our upper limit for Nano wave b would be 1.618x Nano wave a, which gives 3206. If/when that region is breached, we will update our wave count accordingly. SPX ended the week with a negative short term divergence, which suggests another pullback may be on the horizon.
Short term support is at the 3156 and 3121 pivots, while resistance is at the 3180 and 3210 pivots.
GLOBAL MARKETS:

CHARTS: https://stockcharts.com/public/1269446/tenpp
Have a good week!

https://www.cnbc.com/2019/12/29/trump-retweets-post-naming-alleged-whistleblower.html
Trump posts whistle blower name. Putin new method of silencing opponents.
Not a single outcry. Phil thinks this has nothing to do with finances or the future of our economy. In Germany they did great with tactics like this. Push the envelop ever further. Make these actions today seem normal. This has been accomplished. What is next? Pardoning the murder of the whistle blower? Not such a stretch considering that is the intent. Dare cross the DON and you pay the price.
Only in Russia? We are so much alike now. People think we can sustain a healthy business environment? Just like Russia has.
We live TODAY in such outrageous political dystopia where the majority of the masses either think it’s a phase or personally insignificant. Numbed by daily outrageous behavior. We might have 5 more years of this and many think that’s a good thing. Guaranteed disaster. Yes political choice reflects economic disaster. My number ONE betting method for 2021. I made the trade war my number one betting method in 2019. How did that turn out? Play what is given to you. I will play the ONE MAN’s self destructive nature. One billion loss spread out over 10 straight years and we praise his acumen in business? Phil will explain it to you. He is a genius. He can’t possibly do to us what he did to himself. Oh how he tries.
LikeLike
getting emotional about markets ?
emotional trades are losing trades
LikeLiked by 4 people
Wedgie…

LikeLike
Do you have a count on iwm or xlf xevax?
LikeLike
Pingback: Homepage
Could keep going straight up or end here and overlap 1-4…..

LikeLike
Not log scale, exponential…..

LikeLike
how about some simple cave man stock analysis
when a stock market goes straight up like this
the peak off the straight up part
is almost NEVER the final peak
its the momentum peak
which is then followed later by the price peak
in commodities this may not be the case
since not all stocks peak at once like a single commodity might do
LikeLiked by 2 people
there is essentially zero chance of any recession well into next year
if that is the case
there is essentially zero chance of any 30 to 40% correction
which is almost never seen without a recession
BCI continues to go thru the roof
SPX continues to go thru the roof
LikeLiked by 4 people
LOL, everyone think the ship will sink, not that the water will disappear from beneath it….This makes for “the perfect storm” 🙂
LikeLiked by 1 person
This chart and the website indicated are great resources. Thank you for posting–I’ve added them to my favorites. The BCIg trend and present level appear to be key here. Very valuable information in this chart.
LikeLiked by 2 people
Click to access ETI120919.pdf
welcome james
here is another to watch
if it breaks to the upside …all clear given
LikeLiked by 3 people
Click to access US%20LEI%20PRESS%20RELEASE%20-%20DECEMBER%202019.pdf
LikeLiked by 2 people
Did you show me evidence of a recession before the 1929 crash? it is not about recession. You can give someone 20 credit cards to max out and pay the minimum. on the surface you will not see a problem. Excesses like the mortgage debacle was not caused by a recession. GREED and the Feds advancement of that greed. The spigot is open. In 1929 the decade long run assumed earnings will keep pace, assumed they achieved a new paradigm, and NO ONE SAW THE CRASH. Alternative reality today means you can make up anything and it becomes the truth. Tell me the debt situation isn’t proportional to the rise in the markets. accelerate debt and the world looks wonderful. not a single person HERE ever discusses the debt and how it will be resolved. In 2015/2016 that was the main topic on the fundamentals. The exponential rise in debt since then negated that argument? It’s like take an outrageous lie and run with it because so far there is no negative outcome. The world is awash in debt Just to try to sustain social programs debt will always increase. The false pledge was that boosting corporations will lift all. The massive tax cut is showing marginal improvement in standard of living. Getting a penny out of the dollar spent isn’t a good practice BUT who cares, debt will just get larger and everyone will accept that.
You had a massive world shattering event with one scheme initially set up by one brokerage firm. Not very long ago we plunged on the SP 500 to 666. Today we are no smarter in preventing disaster than 1929. Warren Buffet first warned on danger of mortgage-backed securities and other derivatives came on February 21, 2003. That’s when Warren Buffett wrote to his shareholders, “In our view, however, derivatives are financial weapons of mass destruction, carrying dangers that, while now latent, are potentially lethal.” A tad early wasn’t he.
Today his warning is less immediate and dire but non the less he sees such a huge discrepancy in valuation that he refused to buy in. YOU see the start of a new paradigm.
BTW the Shiller Index is at 31.3. Third highest reading ever. In 1999 it was 44.2. In September of 1929 it was a tad higher than today at 32.6 So tell me BOTH these indicators don’t spell trouble. Not just warning of a normal recession either. in all instances these readings spelled deep drops.
But ignore what you can’t fit into your world. That’s the new paradigm, believe your own bias and support that view using blinders and alternative truths. This is NOT sustainable.
LikeLiked by 1 person
Broken clock? Insane. I have charts that date back many decades. they ALL showed the same result. ALL. Peak valuations in Shiller and Buffet indicator ALL showed it was never sustainable at these levels. not just that but it was a prelude to a deep drop.
I must be looking at different charts. See what you want but MY real chart has real data behind it. Keep telling yourself Buffett is old school and doesn’t understand the dynamics of finance. You dismiss him without a word. it doesn’t fit your biased view so dismiss it. That is the new paradigm all right, believe what you want and look for reinforced articles to keep you believing. By showing massive debt buildup you just dismissed debt as a problem. Got it! 3 rate cuts during the biggest stock rally and absurdly low rates to start with. Got it! no problem. I deal in common sense. we are so out of whack with reality it is mind boggling. But hey the same 40% read the news they prefer and that keeps them happy. Disillusioned but happy. Housing run up yet again? Not a problem.
LikeLiked by 2 people
WOW I must be looking at a different chart. The RED is the market correct? The shaded area the recession correct? I see every single drop in the stock market STARTED BEFORE the recession. In almost ALL cases the stock market peaked BEFORE you saw a recession coming. How does that help?
LikeLiked by 1 person
Come in PHIL. Please correct my novice approach to your recession chart. Clearly i am reading it wrong.
LikeLike
yes
you are wrong
stick to emotional trades
LikeLiked by 3 people