
REVIEW
The week started off well enough with a rally to within two points of the SPX 1884 all time high by Tuesday. Then weakening upside momentum and the continuous slide in the NAZ (down 6 of the last 7 days) helped take the market down for the rest of the week. For the week the SPX/DOW lost 2.20%, the NDX/NAZ lost 2.05%, and the DJ World index lost 2.40%. Economic reports for the week were good: seven positive to three negative. On the uptick: wholesale/business inventories, retail sales, export prices, the M1-multiplier, the WLEI, and weekly jobless claims were lower. On the downtick: import prices, the PPI and consumer sentiment. Next week is FOMC week: with Industrial production, housing and options expirations. Could be a wild one.
LONG TERM: bull market
For the past several months we have had a difficult time tracking this bull market. Prior to that, and up until the summer of 2013, the four major indices (SPX/DOW/NDX/NAZ) were rising relatively in unison. The cyclical DOW was the first index to deviate from the general market pattern. This put the cyclical/growth hybrid SPX pattern in the middle of the cyclical DOW and the growth NAZ/NDX. Several times we thought Primary III was topping because of the DOW pattern. And, several times we were wrong.
Tracking four separate market indices objectively, becomes difficult when three of the indices are displaying different wave patterns. In the end, or likely before during Primary wave IV, they will all realign into the Primary wave V high. We have called this phenomenon a trifurcation. Please note, all of these indices are still in bull markets. Just their respective wave patterns are different.
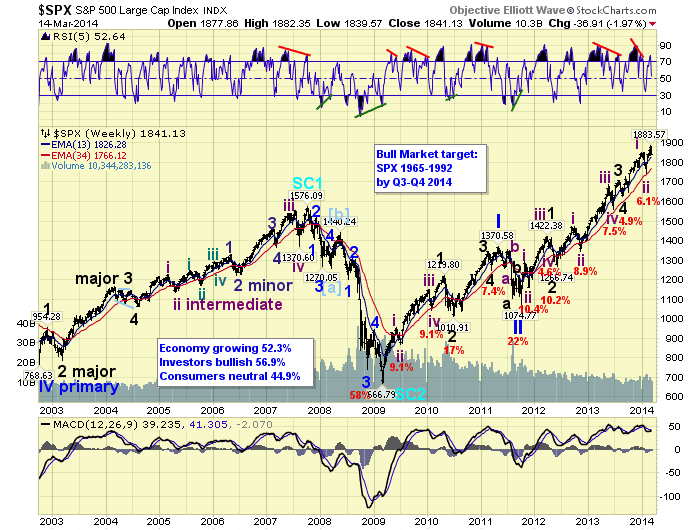
The SPX is the index most follow, so we follow it as well. Despite this week’s decline the most obvious count still appears to be an Intermediate wave iii, of Major wave 5, uptrend. The SPX recently made all time new highs by about 2%.
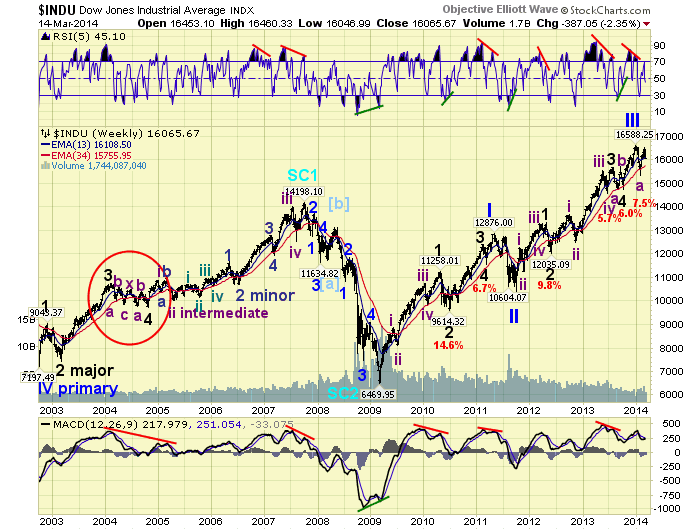
The DOW, which as you know we prefer to track, displays a potentially different pattern. Not only has it not made new highs, this uptrend has not even reached the all time high set in December. The most obvious count here is that the DOW completed Primary III in December, and has entered a wide trading range while the SPX/NDX/NAZ complete their Primary wave III. We highlighted a similar potential trading range pattern that occurred in 2004. There are other counts, but this is the most obvious.
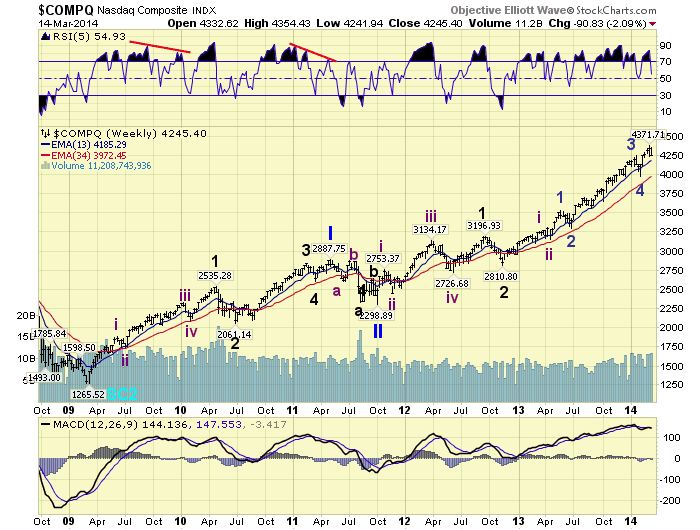
The NAZ represents the growth sector, and it is in a completely different count than either the SPX or DOW. Currently it is in Minor wave 5, of Intermediate wave iii, of Major wave 3, of Primary III. When the current uptrend concludes it will end Int. iii. Then it will still have two more uptrends to end Primary III: Int. v ending Major 3, and then Major 5.
Of these three indices, clearly the NAZ is the most bullish until its Primary III ends. The SPX is also bullish, but the DOW is potentially neutral. Obviously, for an investor/trader, it is much easier just to track one index. We do not have that luxury as we track more than thirty. We repeat, however, despite the current the different counts we are still in a bull market.
MEDIUM TERM: uptrend
From the early February downtrend low at SPX 1738 we have been counting this uptrend as Intermediate wave iii of Major wave 5. At that Intermediate wave ii low we had a RSI positive divergence, and an oversold MACD. After the initial surge off that low, which was quite impulsive, the SPX rallied to a new high at 1868. Then it pulled back to SPX 1834, before rallying quite strongly to another new high at 1884. This week that second rally was nearly completely retraced. It was fully retraced in the DOW/NDX.
We initially counted the SPX 1868 high as Minor wave 1, and the 1834 low as Minor 2. Then we thought, Minor 3 was underway with the rally to higher highs. The negative daily RSI divergences in all four major indices, however, took hold at the new highs and the market pulled back. The most obvious count in the SPX now appears that Minor wave 2 is unfolding in an irregular pattern: 1834-1886-1840 thus far.
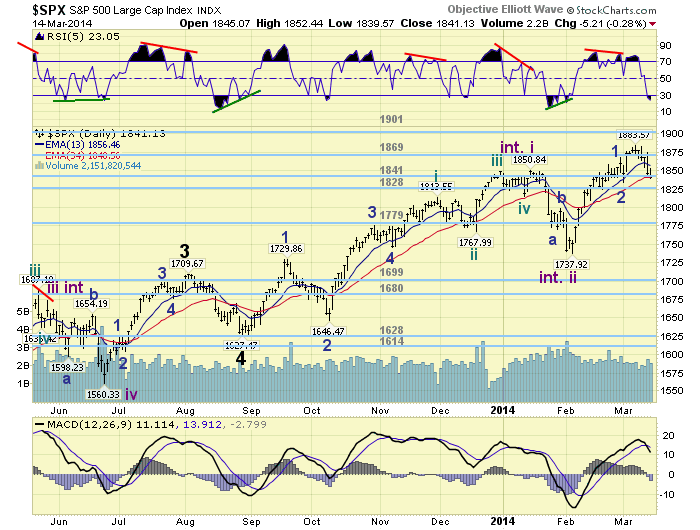
A retest of SPX 1834 would complete a bullish irregular flat. A further decline to SPX 1825, the beginning of that Minute iv triangle, would create an irregular zigzag. Either one works, as well as, even a failed flat: where the C wave does not reach the A wave low. Currently the daily RSI is oversold, which also occurred during Minor 2 of the last uptrend. In fact, all four major indices are similarly oversold. Next week should put this market to the test. Medium term support is at the 1841 and 1828 pivots, with resistance at the 1869 and 1901 pivots.
SHORT TERM
Short term support is at the 1841 and 1828 pivots, with resistance at the 1869 pivot and SPX 1884. Short term momentum ended the week with a positive divergence. The short term OEW charts are negative with the reversal level now SPX 1858.
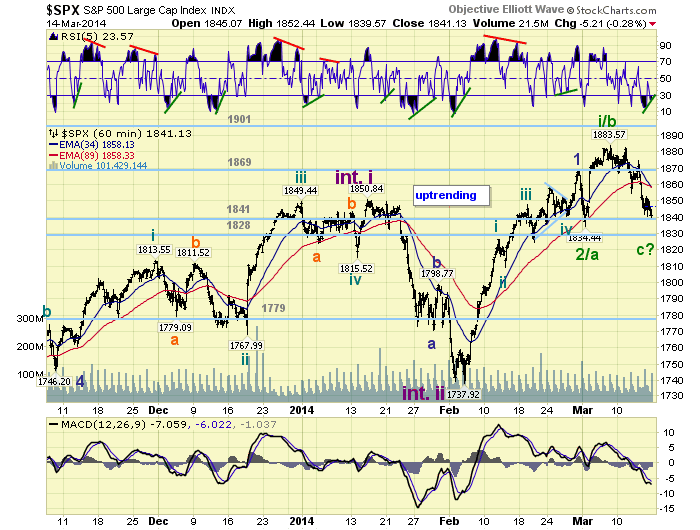
The hourly chart displays a somewhat choppy pattern, between SPX 1825 and 1884, after the initial two week surge of this uptrend. The triangular Minute wave iv is an acceptable pattern, but it can also be counted as corrective. Which would make the entire uptrend corrective, like some sort of B wave. For now, the 1841 pivot range is providing support. Should this give way and the SPX enter the 1828 pivot range, then break through that, the B wave uptrend scenario would definitely gain in probability. This week should be the tell.
FOREIGN MARKETS
The Asian markets were mostly lower on the week losing 2.0%.
The European markets were all lower losing 2.6%.
The Commodity equity group were all lower as well losing 3.9%.
The DJ World index is still uptrending but lost 2.4%.
COMMODITIES
Bonds remain in a downtrend losing 0.6%.
Crude appears to be downtrending losing 3.6%.
Gold shrugged off the negative divergence and resumed its uptrend gaining 3.2%.
The USD remains in a downtrend and lost 0.6% on the week.
NEXT WEEK
Monday: the NY FED at 8:30, Capacity utilization at 9:15, then the NAHB housing index at 10am. Tuesday: Housing starts, Building permits and the CPI. Wednesday: the Current account deficit and the FOMC ends it meeting. Thursday: weekly Jobless claims, existing Home sales, the Philly FED and Leading indicators. Friday: Options expiration. There will be a press conference on Wednesday at 2:30 with FED chair Yellen. On Friday: FED governor Stein gives a speech after the market close. Best to your weekend and week!

Afternoon. Futures roll this week. Opex exp. and fed meeting….. keep all hands and feet inside the vehicle its going to be wild…… gl to us all- we are going to need it! hahahha
LikeLike
Regardless of int ii or minute 2 odds still favour for a gain. I added to my longs this morning. Key for me is SPX @ 1874. /ES, /TF, /NQ and /YM all playing along together with Europe. Breadth possitve.
LikeLike
Namaste Tony !
Its getting very confusing. Dow, Spx and Naz when you are putting that c there on Spx.
How much you think Russia can hurt or how much Russia will get hurt when they plan to take out money.
LikeLike
SPXU Hourly, 3-11-2014 Low $55.54 to $59.37 High on 3-14-2014 appears impulsive, 21 trading hour cycle. Match. Elliott Wave Oscillator, confirmed the higher move on hourly time frame. -.11 reading to 1.78 high reading on 3-14
Might go long SPXU, 10:00 A.M. Low on 3-13-2014 to today’s close will be 20 trading hours, Tuesdays, first hour of trading, 21 trading hour. Match!
Today, breath numbers favor the upside.
Will be monitoring the last hour of trading today, eyeing, SPXU for Tuesday.
GL.
LikeLike
SPXU hourly Elliott Wave Oscillator, reading at .54 currently, Price at $57.64
Once Elliott Wave Oscillator hits 0.00 most likely will confirm three wave pullback.
Time target: last hour of trading today, Might go long SPXU in the next 3 to 4 trading hours.
LikeLike
Namaste
Crimea is an interesting situation.
When they were ruled by Russian puppets they had no problem being part of the Ukraine.
Now with that likely over, the Russians there want the homeland umbrella again.
Since it is barely connected by land to the Ukraine, and Russia needs that strategic port.
Think the West should negotiate with the Ukraine gov’t, after they have new elections, to allow Crimea to spin off to Russia if desired.
When that time arrives, there should be an internal peace force sent to Crimea, and Russia’s military should leave.
Then the Crimean’s should have a new referendum to spin off or remain.
This of course would take months to unfold, but it appears logical from this outsiders perspective.
In the mean time there will probably be a lot of saber rattling.
LikeLike
True Tony !
Everything is based on power and money..that port is very strategic for Russia.
Only worry is Russian Stock Markets whose movement can shake its economy.
In 2008- USA, 2010-12- Europe, 2014- Russia and 2015/16- Asia.
are you able to square this query ?
LikeLike
Have been expecting the Russian Rigged Roulette Trading System to retest the 2009 lows this decade.
Has been in a bear market since 2011, like Brazil.
The USA has seen its low, most other world indices have not
LikeLike
RUT 2k fading
LikeLike
Hey Tony,
Is the USD gonna hold 79? The Dollar looks terrible, downtrending since last July at 85, but coming into the 79 area where there’s very strong support. Perhaps another $10b of tapering Wed gives the Dollar the kick in the pants it needs to get going?
LikeLike
been waiting for about DXY 79
LikeLike
Oversold conditions gone with today’s big gap-up, resistance around 1,870 to build a potential right shoulder on the S&P. Neckline at 1,840, a break below projects 1,780 – 1,800 S&P.
Fed Wednesday, another $10b of tapering is the concensus, dropping QE to $55b/mo.
VIX has been acting as expected, last week we eclipsed the highs of a couple weeks ago of the mid 16’s, high last week of near 18. This week should be low VIX, next week business picks up slightly but the fireworks really begin in 2 weeks. The last week of March/first 2 weeks of April, expect the VIX to test the 20/21 resistance at minimum, a break above sends the VIX to 24-26.
LikeLike
Balance of Power indicator by TC2000 is not confirming this NYSE move higher today, matter of fact, Fridays BOP reading was +18 vs today’s -3 reading.. Large spread.
Similar to the 1-13-2014 when NYSE move higher to 10,373.99 then, reversed the next day to 10,241.32
Keep tight stop loss! TSV and BOP which are two indicators, not confirming this higher move today.
GL just my observations..
LikeLike
Thanks Tony, great weekend update. Still Bullish. 😉
SPY~ WPP @ 185.94 (Hit)
50.0% ~ 186.72 (Hit)
61.8% ~ 187.26
GLTA
LikeLike