Weekend Report
Provided by the OEW Group
October 5 2019
SPX opened the week up and rallied most of the day Monday to close at 2977. Last weeks close was 2962. Tuesday had a gap up to reach the high of the week at 2993 within the first half hour of trade, but then sharply reversed lower, apparently based on the bad ISM report signalling a contraction in manufacturing. SPX then sold off the rest of the day Tuesday, gapped down on Wednesday and continued to decline until it found the low of the week at 2856 in the first hour on Thursday. From there, SPX rallied to reach 2911 by Thursday’s close. Friday opened with a gap higher and continued a strong rally all the way back to within Tuesday’s price range, before closing the week at 2952.
For the week, SPX/DOW lost 0.33%/0.93% while NDX/NAZ gained 0.94%/0.54%.
On the economic front, ISM Manufacturing and Services were both lower, although Services remains in expansion mode. Payrolls were higher as the unemployment rate made a 50 year low at 3.5%. Our Investor Sentiment indicator increased to 56.5% and is quite bullish as we read the data. The ECRI weekly growth indictor moved up for the third week in a row and is back above the zero line at +0.83%.
LONG TERM: Uptrend may be weakening
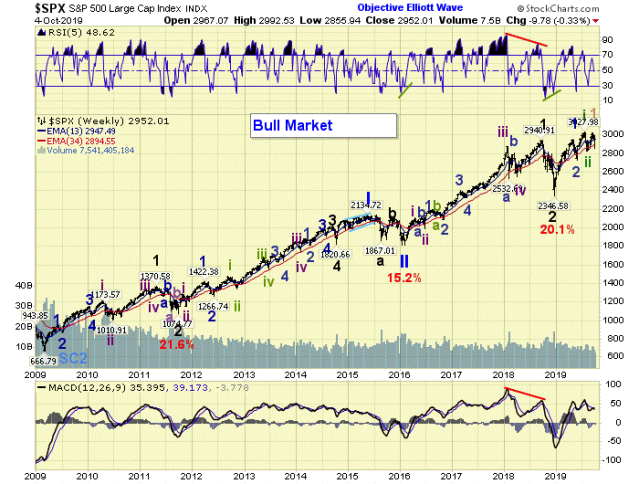
In the US, the long-term count remains unchanged with the Super Cycle SC2 low in March 2009. The Primary wave I high occurred in May 2015 and Primary wave II low in February 2016. Primary wave III has been underway ever since and the Major wave 1 high of Primary wave III occurred in October 2018. Our preferred long term count is posted on SPX, which reflects that Intermediate wave i of Major wave 3 is underway from the Major wave 2 low in December 2018 and continues to subdivide into Minor, Minute and now Micro waves. However, we maintain our cautious status that the uptrend may be weakening until Major wave 3 can clearly breakout of this overlapping structure. Consequently, we’re still tracking our alternate count on DOW in the public chart list.
MEDIUM TERM: Downtrend
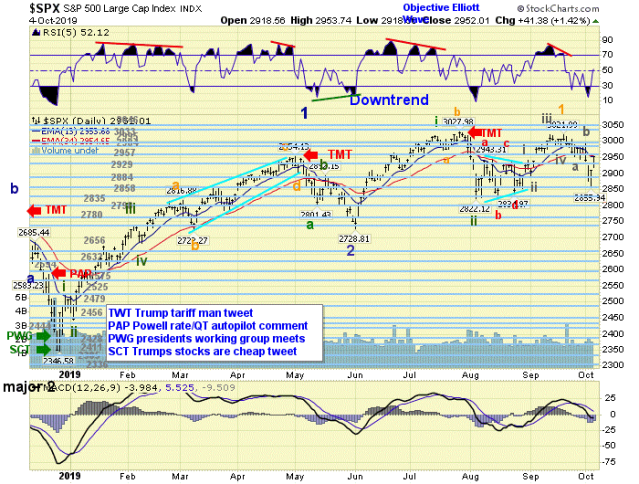
SPX extended the decline with a large outside reversal down on Tuesday (same as last week), followed by a gap below the critical 2940 level mentioned last week and reached a low of 2856 Thursday morning. A strong reversal for the remainder of the week retraced halfway back for the entire decline from the 3022 high. SPX finished the week at 2952, which is within the next pivot range and just below the medium term EMA’s which are providing resistance for the time being. This price action confirmed that a new downtrend is underway with the possibility of a completed pattern at the 2856 low. This also resolved the scale dilemma that we’ve been discussing for the last few weeks. As a result, we can now count five waves up from 2822 to 3022 with a small fifth wave, which suggests the entire uptrend is Micro wave 1 of Minute wave iii. Micro wave 2 has been underway since the September top and found support at our 2858 pivot range, with medium term subdivisions that suggest a completed zig zag pattern of three waves down. This represents a 5.5% decline, which would be typical for this wave scale. However, we need more price action to see if a new uptrend can take hold, or whether another retest of the low may be forthcoming. Medium term RSI got sufficiently oversold at the low, which is consistent with prior downtrend lows.
SHORT TERM
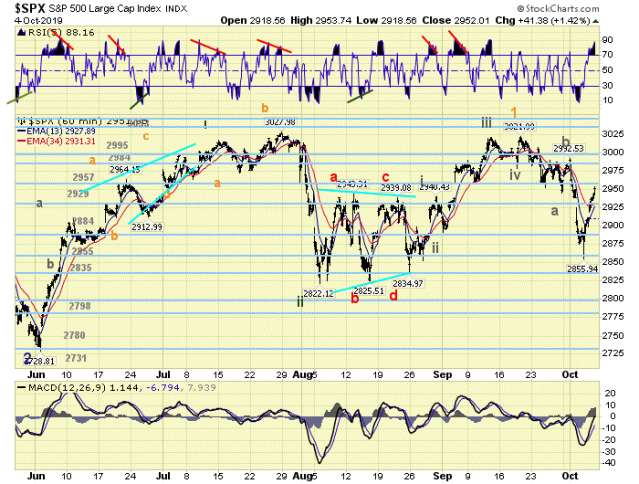
As mentioned in the previous section, we’ve rescaled the count to show Micro wave 1 as five Nano waves up from 2822 to 3022, which includes a subdivided leading diagonal for Nano wave i as part of that sequence. Using our short term techniques we can count seven small wave down from the 3022 top, which suggests a 5-1-1 zig zag pattern for Micro wave 2 so far. That gives Nano wave a = 2946, Nano wave b = 2993 and Nano wave c = 2856. We then have a 98 point rally off the low to the intraday high on Friday, which is by far the largest retrace since the downtrend began. Short term RSI ended the week extremely overbought, so a small wave pullback could come at any time. With all the volatility this week, SPX ended right back in the same support/resistance zone where it left off last week. As one of our members pointed out while discussing group sentiment, “nothing has changed”. So far, only the speculative short term waves have been affected.
Short term support is at the 2929 and 2884 pivots. Resistance is at the 2957 and 2984 pivots.
FOREIGN MARKETS
Asian markets (using AAXJ as a proxy) gained 0.83%.
European markets (using FEZ as a proxy) lost 1.49%.
The DJ World index lost 0.90%, and the NYSE lost 1.08%.
COMMODITIES
Bonds are in a downtrend and gained 1.17%
Crude oil is in a downtrend and lost 5.54%
Gold is in an uptrend and gained 0.43%
GBTC is in a downtrend and gained 3.89%.
The USD is in an uptrend and lost 0.22%.
CHARTS: https://stockcharts.com/public/1269446/tenpp
Have a good week!


http://schrts.co/teQWqaBX
Enough said.
LikeLiked by 3 people
It’s firming up nicely now. Again, this nasdaq chart is the easiest count to follow. The last 2 1/2 months have been nothing more that a simple flat correction. Very basic stuff. Ascending triangle now too in the dow. Don’t try to over think this. It’s still a bull market and they don’t have to end in 10 years. Think 1950s and 60s, 1980s and 90s. The last 2 1/2 months appears to be good ole fashioned base building. We’ll see. Good Luck
LikeLiked by 2 people
How do you tell if these last few days are “impulsive” moves?
They certainly look that way.
LikeLike
Like you see it on the Rut, the anticipated c up to breaching Ath is an abc corrective wave. The impulsive character doesnt show until a wave 3 (w-1 is corrective) and of course the 5th when the trend is firmly established.
Tumultuous rises are abcs corrective, which fits nicely with the macro-climate of today.
LikeLike
Hi Rob, there’s no way to know for sure. Cbiz did a nice job of counting 5 waves up on the 3 day rally last Thur, Fri and Monday, but that could still be part of a larger corrective wave. However, there are other clues supporting an upturn right? The ABC flat over the past 2 1/2 months looks like it could be finished. The seasonal is due to turn up, the 9-10 month cycle may be bottoming, potential for some agreement in trade, just to name a few possibilities. When we can confirm an OEW uptrend, then we can count the ii wave as complete……Good luck
LikeLike
the FED does not control rates
that should be obvious by now
what the fed wants is irrelevant
LikeLiked by 1 person
Gary Lewis
this is why i dont hold overnite SPXS
risk was up to 61 on shorts
and they broke it
you now fall back to the series up from 2882
we are in # 4 traditional up
bull above 2957
target 2980
below there the entire series up breaks
will discuss if it happens
good luck !
LikeLiked by 2 people
2980 es target coming up
take partial profits
with an eye on 2990 at – 618 target
LikeLike
BOOM!
protect profits at 76
take profit at 90
LikeLiked by 2 people
exit at 2984 spx cash
see ya!
LikeLike
EURO
screaming higher
short squeeze
but take partial profits at daily upper boll band
LikeLike
Well as much as some want to ignore news (or fake news) as a reason behind strong market moves, ES just ramped 90 pts from its Globex low of yesterday at 2’881 … as it did from its low of 2’855 on October 3rd to its high of 2’953 less than 24 hours later on October 4th !
LikeLiked by 2 people
The set-up for the SPX to breakout above 3025 is here and now. The Crash or correction all were calling for is now null and void. This isn’t last year and we are in the best time of the year to buy.
LikeLiked by 2 people
Agree strongly.
LikeLiked by 3 people
Gold trying to break that neckline again
https://invst.ly/ja3e2
LikeLiked by 3 people
Would not be shocked to see gold around $1350-70 by year end.
LikeLiked by 3 people
The H&S measures about $1425 (133.82 on GLD).
Its the higher Treas rates that are killing it.
Institutions are shocked to see any yield these days.
But there are Neg Divs on equities as well. Loads of them.
Can’t see any rally sticking for long.
Certainly the FED doesn’t want higher rates on 2-10s.
But everybody has to pick their battles.
LikeLiked by 1 person
The FED can certainly control rates (long and short), but only for a period of time.
And now the time is up, on the 2-10s.
10s should be at least 4.00% which is where the FED started their crazy QE
(price controls, by a different name).
10 year Treas. up .08 today.
Up 14% in 4 days.
If they can’t reign that in, there will be some wreckage.
Please send in your checks for the next bailout.
LikeLiked by 1 person
Anybody who doesn’t understand that the FED has tools to control rates is poorly informed.
Basic content on any NYSE registrations includes this function of the FED (traditionally called Open Market Operations). There is no Series 7 individual in the U.S. who does not understand that.
That’s the basic standard for working with securities.
LikeLike
FED follows rates
it does not lead
https://www.elliottwave.com/Economy/The-Fed-Follows-the-Market-Yet-Again
LikeLiked by 1 person
Phil is so terribly mistaken about this that its almost comical.
The FED controls short-term rates via the Fed Funds rate. As you said Tom, this is basic info and anyone who would get up in front of a group of money managers to say anything different would be laughed off of the stage.
LikeLiked by 2 people
You should learn what a primary source is.
As opposed to what you quote, which is not even a secondary source.
LikeLiked by 1 person
It’s also equally comical that Phil ALWAYS quotes EWI as a source on this. He never references anyone else. Ya know why?
Cause no one agrees with such a convoluted erroneous claim.
LikeLiked by 1 person
Tom
cant you remove your BIAS about what the fed can and cant do
and just look at the chart ?
cant you see whats in front of you ?
or do you prefer to believe market myths and old wives tales ?
LikeLike
Phil,
Just the list of RRs yourself, and straighten ’em all out.
I’ve done most of the work for you already.
Report back when done.
LikeLike
The Fed had an easy time with rates, as long as the World was severely corrupt and malfunctioning. Trump changed that trend, and a major trend change can never be manipulated against. Lesson from M.Armstrong.
LikeLiked by 1 person
I don’t think it’s about anything Trump is doing (although he might well get blamed for it).
The acknowledged fact is that the world economy is short of $Dollars. That’s what the recent Repo-story is about.
What is not said, but some private sector economists suspect is the the U.S. budget deficits are sucking the economy dry, like sucking oxygen out of the room.
If that suspicion is correct, the FED’s recently announced QE is much more that than what Powell is letting on.
Oh, Oh, sorry,
This is potentially news, and we all know that news doesn’t matter.
LikeLike
Trend is up, thats what matter the most. Cause and effect isnt how nature operate.
LikeLiked by 1 person
Tore
we know you are correct
but you are never going to convince people
who would rather believe myths and old wives tales
under the pretense that they know better than Ms Market
thats why money manglers are getting destroyed
and retired senior citizens
are schooling them how markets work
LikeLiked by 1 person
Hey Phil,
As of 2018, there were 629,847 Series 7 Registered Reps in the U.S.
If I can get the mailing list, you can set them all straight.
FINRA Statistics
Go for it.
LikeLike
Hey Tom
just like the fed ……. if they believe what you say
as cramer says
” they know NOTHING !”
LikeLike
Fotis, could that not be an inverse H&S….
LikeLike
If it breaks upper TL out of short and go with the Bullflag
https://invst.ly/jmx0k
LikeLike
CL good place to start nibbling longs Stops 51.9 targets 57 63 72
https://invst.ly/j6l35
LikeLiked by 4 people
Let’s examine DGAZ (the opposite of UGAZ).. its progression suggested 152, so it has gone beyond, to a DT, suggesting UGAZ “should” go up shortly…..11 is a number of recognition for UGAZ, but there is more symmetry at this price point….
https://stockcharts.com/freecharts/gallery.html?DGAZ
LikeLiked by 2 people
Ms, Margaret many months ago you posted a site which gave very good informed on biotech started -date of different phase testing. Do you by chance have that site address. thanks in advance
LikeLike
Gorr, are you sure it was me?
Blue and Wags are the experts on Bio…do ask them…they will be delighted to help.
And I hope you do well……
LikeLike
Blue and Wags are the same person. He posts under different user names so that it doesn’t seem like he over posts, or has conversations with himself.
LikeLiked by 6 people
Give it a rest man lunker and swamper are also the same stop embarrassing yourself.
LikeLiked by 1 person
fotis, mind your own business. focus on yourself.
LikeLike
fotis,
You’re a mess. You are listening to ghosts.
Every day you complain about how many DH post there are and then Monday when there were no DH posts you complain about that.
Proves you’re not happy with anything!
LikeLiked by 1 person
Natgas is Strong Buy.
UGAZ is Strong Buy and HOLD.
(PS. The morons need not reply, they should go bark some place else).
ha ha ha …. 😀
LikeLiked by 2 people
By the way, when I say Buy and Hold, I don’t mean hold for months, years or life, Hold means 1-2 weeks. Hope some kids understand now. 😀
LikeLiked by 2 people