Weekend Report
Provided by the OEW Group
October 5 2019
SPX opened the week up and rallied most of the day Monday to close at 2977. Last weeks close was 2962. Tuesday had a gap up to reach the high of the week at 2993 within the first half hour of trade, but then sharply reversed lower, apparently based on the bad ISM report signalling a contraction in manufacturing. SPX then sold off the rest of the day Tuesday, gapped down on Wednesday and continued to decline until it found the low of the week at 2856 in the first hour on Thursday. From there, SPX rallied to reach 2911 by Thursday’s close. Friday opened with a gap higher and continued a strong rally all the way back to within Tuesday’s price range, before closing the week at 2952.
For the week, SPX/DOW lost 0.33%/0.93% while NDX/NAZ gained 0.94%/0.54%.
On the economic front, ISM Manufacturing and Services were both lower, although Services remains in expansion mode. Payrolls were higher as the unemployment rate made a 50 year low at 3.5%. Our Investor Sentiment indicator increased to 56.5% and is quite bullish as we read the data. The ECRI weekly growth indictor moved up for the third week in a row and is back above the zero line at +0.83%.
LONG TERM: Uptrend may be weakening
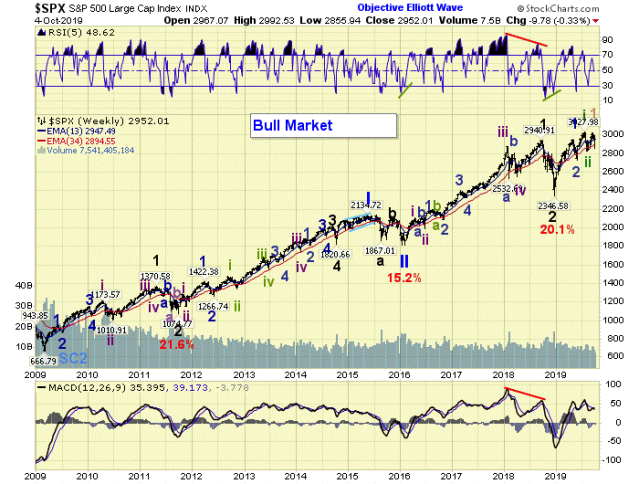
In the US, the long-term count remains unchanged with the Super Cycle SC2 low in March 2009. The Primary wave I high occurred in May 2015 and Primary wave II low in February 2016. Primary wave III has been underway ever since and the Major wave 1 high of Primary wave III occurred in October 2018. Our preferred long term count is posted on SPX, which reflects that Intermediate wave i of Major wave 3 is underway from the Major wave 2 low in December 2018 and continues to subdivide into Minor, Minute and now Micro waves. However, we maintain our cautious status that the uptrend may be weakening until Major wave 3 can clearly breakout of this overlapping structure. Consequently, we’re still tracking our alternate count on DOW in the public chart list.
MEDIUM TERM: Downtrend
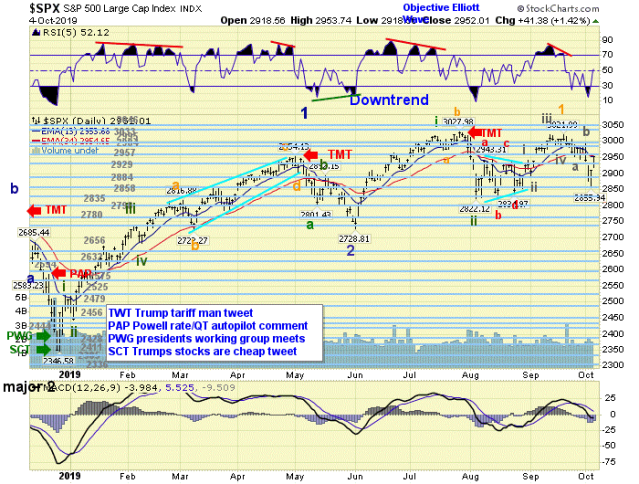
SPX extended the decline with a large outside reversal down on Tuesday (same as last week), followed by a gap below the critical 2940 level mentioned last week and reached a low of 2856 Thursday morning. A strong reversal for the remainder of the week retraced halfway back for the entire decline from the 3022 high. SPX finished the week at 2952, which is within the next pivot range and just below the medium term EMA’s which are providing resistance for the time being. This price action confirmed that a new downtrend is underway with the possibility of a completed pattern at the 2856 low. This also resolved the scale dilemma that we’ve been discussing for the last few weeks. As a result, we can now count five waves up from 2822 to 3022 with a small fifth wave, which suggests the entire uptrend is Micro wave 1 of Minute wave iii. Micro wave 2 has been underway since the September top and found support at our 2858 pivot range, with medium term subdivisions that suggest a completed zig zag pattern of three waves down. This represents a 5.5% decline, which would be typical for this wave scale. However, we need more price action to see if a new uptrend can take hold, or whether another retest of the low may be forthcoming. Medium term RSI got sufficiently oversold at the low, which is consistent with prior downtrend lows.
SHORT TERM
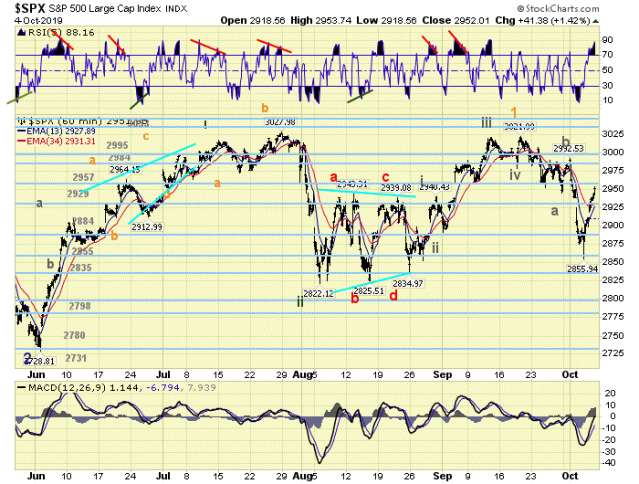
As mentioned in the previous section, we’ve rescaled the count to show Micro wave 1 as five Nano waves up from 2822 to 3022, which includes a subdivided leading diagonal for Nano wave i as part of that sequence. Using our short term techniques we can count seven small wave down from the 3022 top, which suggests a 5-1-1 zig zag pattern for Micro wave 2 so far. That gives Nano wave a = 2946, Nano wave b = 2993 and Nano wave c = 2856. We then have a 98 point rally off the low to the intraday high on Friday, which is by far the largest retrace since the downtrend began. Short term RSI ended the week extremely overbought, so a small wave pullback could come at any time. With all the volatility this week, SPX ended right back in the same support/resistance zone where it left off last week. As one of our members pointed out while discussing group sentiment, “nothing has changed”. So far, only the speculative short term waves have been affected.
Short term support is at the 2929 and 2884 pivots. Resistance is at the 2957 and 2984 pivots.
FOREIGN MARKETS
Asian markets (using AAXJ as a proxy) gained 0.83%.
European markets (using FEZ as a proxy) lost 1.49%.
The DJ World index lost 0.90%, and the NYSE lost 1.08%.
COMMODITIES
Bonds are in a downtrend and gained 1.17%
Crude oil is in a downtrend and lost 5.54%
Gold is in an uptrend and gained 0.43%
GBTC is in a downtrend and gained 3.89%.
The USD is in an uptrend and lost 0.22%.
CHARTS: https://stockcharts.com/public/1269446/tenpp
Have a good week!


Phil posted earlier today that my account was “blown up and bankrupt”
Sorry Phil, but I’m tired of you repeatedly posting lies…
Just an average day today: +$18,004.00
🙂
LikeLiked by 6 people
why are you posting this a SECOND time in a new thread at the top of the blog ?
to call attention to yourself ?
why are you pretending i was posting to you
cant you see my response was to lml?
told you before 2 mill…i am not impressed
and you know why
LikeLiked by 1 person
No one cares if you are impressed or not. I sure dont.
Im calling you out (once again) for littering this blog with LIES.
All you do is lie.
LikeLike
looks like you have LOST 150,000 k
since you trolled me with 10 different email names
telling me how much you made on EXAS
and using the same kind of strip with acct balance and markets
except it was almost 2.5 mill 6 mos ago
EXAS in reverse now as is your account
LikeLike
Do not respond to each other’s posts. Both of you adhere to this. You both have merits in your own right but at this moment you both cause problems. Ignore each other’s posts. Stop feeding the fire.
LikeLike
Do not respond to each other’s posts. Both of you adhere to this. You both have merits in your own right but at this moment you both cause problems. Ignore each other’s posts. Stop feeding the fire.
LikeLike
Mr. Wags very impressive, do you make 18 k by active trading today or your account went up because of long term holdings
LikeLike
One more day of this nonsense.. thought for a while that the most bearish thing that could happen would be a trade deal as then the market will have to focus on macro and not BS rumours
LikeLiked by 4 people
es/futures showing an outside day today.
LikeLiked by 2 people
Short at 2945 was great, now waiting for the wedge to resolve and show short term direction.
LikeLiked by 2 people
There is an overnight gap at 2919, so ES could be trying to close it in the next 50 mins. That’s right below 2921 price target and where I’d close the trade for today. Let’s see if ES agrees with me.
LikeLike
NG
bottom about to fall out
LikeLiked by 2 people
NG = no good
LikeLiked by 1 person
1.07
LikeLike
With the right timing, gto 🙂 I anticipate it to bounce to around 2.5 before the nose dive.
LikeLike
Out of ES – will punish this ***** later for such unruly behavior.
LikeLiked by 2 people
LOL!
LikeLiked by 1 person
In case you missed it… but the overnight futures, ES_F, dropped to 2882 yesterday afternoon, non of it evident in cash market as it opened at about even this morning. This could be another “curious case of a missing wave in cash” as I have looked for SPX2880 ideally to be reached for (Orange) micro wave-b of (grey) minute wave-b to ideally SPX2983 as a flat correction. This is not the first time this has happened as most of August lows were full off missing waves… Albeit ES_F doesn’t equal SPX, which doesn’t equal say NAS or DJIA or RUT etc, it does pay to track all indices as to better understand the overall price patterns developing and therewith the overall markets.
LikeLiked by 1 person
Gary Lewis
here is your setup
ext long was nicked
2940 is the ideal short level
stop at 2942
of course you could give it a point but not much more
LikeLike
thanks
LikeLike
welcome
remember these are ideal numbers
but i would not give it 2 points or i am wrong
LikeLike
then you would be looking for 2954
LikeLiked by 1 person
Interesting action at 2940 !!
LikeLiked by 1 person
I’m impressed! as you would say, Swoosh
LikeLiked by 1 person
just posted charts showing this in detail at lunkers Gary
LikeLiked by 1 person
Got a decent profit on it but it was so fast, I wasn’t quick enough. Where do you reload?
LikeLike
retest of 2940 hwb es is ideal short entry
LikeLike
if it holds you are looking for 2815
and risk would be up to 2961 es until 2815 is hit
LikeLiked by 3 people
All bearish factors have just been overwhelmed by the most powerful force in the universe.
Long and strong.
https://www.zerohedge.com/markets/gartman-goes-short
LikeLiked by 4 people
I was going to post that–that’s DENNIS Gartman…lol.
LikeLiked by 1 person
Natgas is ready to blast higher.
LikeLiked by 2 people
Nee to take out 2.3, that will clear road to 2.5 IMO. If 2.5 can be taken out swiftly, then it will get really interesting.
LikeLike
embedded stoch kvilia
ira sez…
it knows the cold is coming but refuses to bounce
be late to this party 😉
LikeLike
Phil,
It needs to bounce now, otherwise next two weeks will be ugly.
LikeLike
UGAZ is a Buy and hold.
LikeLike
A 3x etn a buy and hold? Crazy!!!
LikeLiked by 2 people
Ego can be a bitch if you let it…
LikeLike
Vanguard’s S&P 500 ETF saw $2.9 Billion worth of outflows at the beginning of this week. That’s the largest withdrawal of the year, and the second biggest in the fund’s 9 year lifespan.
LikeLike
And we are witnessing the short squeeze now. So the yo–yo move will most likely get resolved downwards, no science fiction here.
LikeLiked by 1 person
Ummmm….. Massive redemptions out of the VOO are extremely rare. That money is very “sticky” and long-term. Probably an investor or adviser rebalancing.
LikeLike
Breaking news:It’s been discovered that the last name of phil is none other than Dennis Gartman’s twin brother–he’s Phil Gartman–not to be confused with Phil Hartman.Phil’s call of below 2894 means 2879 has cost everyone 60 handles of SPX.Phade Phil and you will definitely own a newspaper.
LikeLiked by 5 people
you must have blown up your account
to have all this time to troll me lml 2 . 5
LikeLike
I thought you weren’t going to respond to me…FOCUS on getting some calls right Gartman.
LikeLike
Insert Lunker post…… “focus on yourself”
LikeLiked by 1 person
oops
hit a nerve
grouchiness = blown account and bankrupt
LikeLike
Sorry Phil, but you keep posting lies about my account and I will call you out for it every single time. – – – Had an average day today. But still way better than yours. 🙂
+$18,004
LikeLike