Weekend Report
Provided by the OEW Group
September 7 2019
SPX opened the week lower on Tuesday (post Labor Day Holiday) and made the low of the week at 2892 within the first hour of trading, then proceeded to rally back and finish the day at 2906, down from last weeks close at 2926. Wednesday had a gap up at the open to retest last weeks close and continued to rally for the rest of the day to reach the highest close since August 8th at 2938. Thursday saw an even larger gap up to make the high of the week at 2986 within the first hour of trade, then consolidated in a narrow trading range for the rest of the day and finish at 2976. Friday had a quiet open and continued to stay in that same narrow range for the remainder of the day before closing the week at 2979.
For the week, SPX/DOW gained 1.79%/1.49% while NDX/NAZ gained 2.10%/1.76%.
On the economic front, ISM non-Manufacturing increased and accelerated, while ISM-Manufacturing declined below 50%. Factory Orders, Unit Labor Costs, Payrolls, Hourly Earnings and Labor Force Participation Rate were all higher, while the rate of job growth slowed. Unemployment rate held steady at 3.7%.
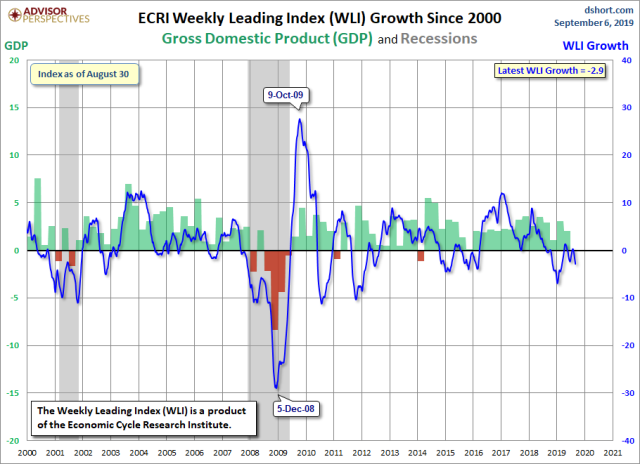
Investor Confidence declined to the lowest reading since December, just below the bullish line and into the neutral range as we read the data. The ECRI growth indicator declined and is now extending the previous low further negative.
LONG TERM: Uptrend may be weakening
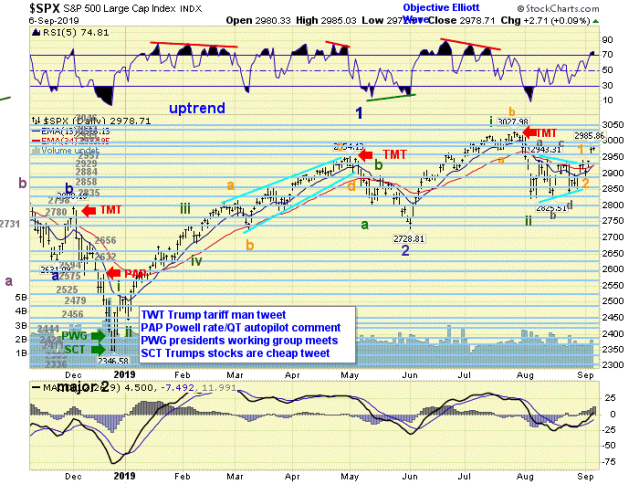
In the US, the long-term count remains unchanged with the Super Cycle SC2 low in March 2009. The Primary wave I high occurred in May 2015 and Primary wave II low in February 2016. Primary wave III has been underway ever since and the Major wave 1 high of Primary wave III occurred in October 2018. We continue to track our alternate count on DOW in the public chart list. No change to our long term count on SPX, as Intermediate wave i of Major wave 3 is underway from the Major wave 2 low in December 2018 and continues to subdivide into Minor and Minute waves.
MEDIUM TERM: Uptrend
SPX broke out on Thursday with a large gap over prior resistance established during the August trading range and reached the high of 2986, before settling in to close the week at 2979, which was sufficient to confirm a new uptrend is underway. We’ve updated the medium term status accordingly, which suggests Minute wave ii bottom has finally been established. Our cautionary posture proved wrong, as the favorable close mentioned last week turned out to be the correct signal that the downtrend was over. We have confirmed uptrends now on all four key US markets that we track as well as 5 of 9 US sectors and China too. However, there are notable laggards including RUT, TRAN, XLE, XLF, as well as some in Asia and Europe. We would expect most of these to confirm in the near future for our long term view to remain intact. There was much discussion and some disagreement within the group over various choices for counting the sideways chop in August. Regardless of the differences, there was strong consensus that Minute wave ii bottom occurred at one of the three lows, 2822, 2826 or 2835 and Minute wave iii is now underway. For now, we’re tracking that price action as a leading diagonal for Micro wave 1 of Minute wave iii from 2822 to 2940, followed by Micro wave 2 pullback to 2892, with Micro wave 3 in progress to 2986 so far. This price structure projects our nominal target for Minute wave iii at around 3200.
SHORT TERM
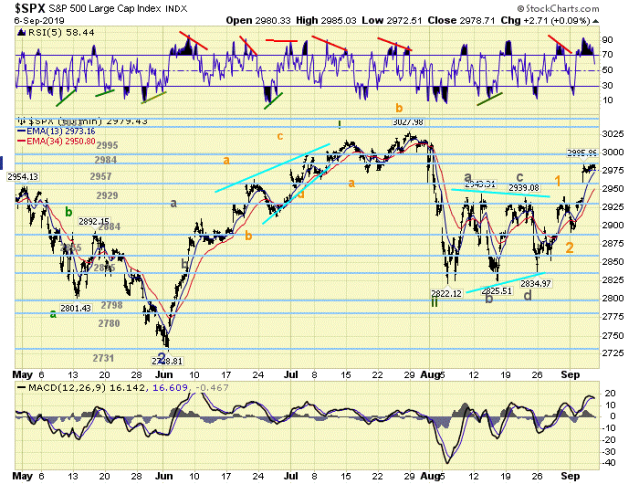
As mentioned last week, the group has come up with several counts to resolve the choppy price action in August, but all of these have various pros and cons relative to our OEW methodology. Some generate odd patterns and others don’t fit with our short term tracking techniques. Yet they all suggest the same basic outcome, which is that Micro waves 1 and 2 are complete and Micro wave 3 of Minute wave iii is underway with possibility of some small wave subdivisions developing. We’ve chosen the one that seems to fit best with our short term tracking techniques and will continue to monitor the other options as the trend evolves. We counted three corrective rallies off each of the August lows as Nano wave a = 2943, Nano wave c = 2939 and Nano wave e = 2940, which suggests the leading diagonal pattern shown for Micro wave 1. Then Micro wave 2 = 2892, which is pretty close to fib 38.2% retracement of the entire diagonal pattern. Micro wave 3 found resistance at our 2984 pivot and has consolidated just below there for the time being. We’re now watching for impulsive price action to continue. If it remains corrective, then something else may be in play. Our initial target for Micro wave 3 is up around 3080.
Short term support is at the 2957 and 2929 pivots. Resistance is at the 2984 and 2995 pivots. Short term RSI ended the week neutral after reaching overbought levels at the high.
FOREIGN MARKETS
Asian markets (using AAXJ as a proxy) gained 2.93%.
European markets (using FEZ as a proxy) gained 1.91%.
The DJ World index gained 1.89%, and the NYSE gained 1.54%.
COMMODITIES
Bonds are in an uptrend and lost 0.25%
Crude oil is in a downtrend and gained 2.58%
Gold is in an uptrend and lost 0.91%
GBTC is in a downtrend and gained 9.99%.
The USD is in an uptrend and lost 0.50%.
CHARTS: https://stockcharts.com/public/1269446/tenpp
Have a good week!


TLT right on support here at 136 ish, if it heads lower next I have a target of 134 ish and next support at 133 area..diagonal also still pointing down.
LikeLike
Thursday was a repeat of a frequent recurring sell signal pattern that I have mentioned here many times. The market gapped up to a confluence of SPX pivot resistance and reversed. (Monthly R1=3019; Daily R2=3018.) That reversal was then followed by a H3BR sell signal. The gap up into the pivot closed and reversed the H3BR long that had triggered at the close on 9/3 at 2906. The H3BR sell signal then doubled the short position at 3011. Average price of short= 3015. Current stop at 3017.34.
The previous occurrences of this signal this year were on 3/4, 5/1, 7/15, 8/22, and 8/30.
LikeLiked by 4 people
Guys thanks for a very entertaining week,and thanks to Christine for allowing some freedom of expression .
And let us not forget the OEW team for sticking to Tony’s rules and guidelines amid plenty of doubters.Even when a previous student tried to cast doubt on the present count in his marketing efforts to promote his subscription service, the guys stuck to their true OEW guns.
LikeLiked by 4 people
You all suck, bam roasted
LikeLike
fotis
i forgive you for your false accusation of me
go ahead and post to your hearts content
i know you have seen that i was truthful
thats all i wanted to show
God Bless !
LikeLiked by 4 people
Let them ban me–I contribute at least as much as I get out of this site now.If you don’t see me for a couple days–you’ll know what happened and I wont try to get back on after being censored.phil goes beserk every day on here and no reprimands.So,whatever.GL all.
LikeLiked by 2 people
lml… your contribution on this blog is more productive than others so please continue and ignore the trolls.
LikeLiked by 2 people
It’s not the trolls–but lunker telling me to watch it–or else….I wont leave voluntarily,but if I do disappear,you’ll know why,is all I’m saying.Back to our regularly scheduled programming.Have a good weekend.
LikeLike
lml….its truly unfortunate what has happened to this comment section. Its become “The Phil Show” 24/7 … alienating many solid posters such as yourself. I hope you stay!
LikeLiked by 1 person
Blog needs different characters, thats what makes it interesting. And humor too; a good trader always beholds the introspective ability to see himself and his descisions from up above 🙂 A solid dose of Elliott Wave is a plus; then we all thrive.
LikeLiked by 3 people
+1 Tore
LikeLiked by 2 people
I agree 100% !
Posting trades zzzzzz
Trade journals zzzzzz
LikeLiked by 2 people
LikeLike
Cr. to CBZ
LikeLike
Gold will be trading b/w 1600-1700 within few days after Fed. is done.
LikeLiked by 1 person
Chart pattern based on prior similar swings suggest the start of a strong long move up. Like in late 2015 and start of Trade War fundamentals have diverged widely. Starting at historically low rates the street is anxious for rate cuts, bond market long warning signs, and earnings projections to justify current prices require a huge jump within 6 months.
Beauty is in the eye of the beholder. Most see a beautiful chart pattern. I see an ugly one. I can’t decipher the current moves but have a strong notion of it’s shortened top. I am as strong on my conviction as i was in late 2015/early 2016 and start of Trade Wars. Till I see another breakdown in pattern i stay away of betting. I will assume external events spark the next reversal. My early warning number one technical method for betting was the silly TWEETS. I was once again early on my calls. the street is now in sync with this method to an astonishing short delay. they are also short tempered on any news of TRADE. In both trade and tweets I warned you all to use them exclusively. Now it’s a given and you lost the edge needed to beat the market.
Recent move extended beyond my expectation and ability to predict reversal points. Only one left is the 3040-3045 that makes sense to me but not putting strong faith in it. A September that holds up over next 2 weeks puts extreme pressure in October.
LikeLike
https://www.cnbc.com/2019/09/14/us-china-trade-wars-unstoppable-global-economic-transformation.html
My view exactly. longer term the world markets will fight for survival. Pushing the two most powerful economies into a protectionist stance will change the landscape for decades to come. It is not reversible. New dynamics old patterns that always end the same. Asia, EU, South America, USA are already creating new partnerships with one over riding premise, distrust the strength of the alliance.
Look at all past economic conditions in history and all geographies to determine if there is a common end result from trade war.. I warned on trade war and tweets. One man started this. One man can change the world landscape for a generation to come. The genie will not be put back in the bottle. I suppose it was inevitable anyway.
LikeLike
…case closed, this is a gold rally to take seriously 🙂
LikeLiked by 2 people