
Weekend Report
Provided by the OEW Group
August 24 2019
SPX started out the week with a gap up and rally to close Monday at 2924. Last week’s close was 2919. Tuesday gapped down at the open, rallied back to fill the gap, then proceeded lower for the rest of the day to finish at 2901. Thursday gapped over Mondays high and made the high of the week at 2939 within the first 20 minutes, then retraced most of the prior two day rally before noon, but recovered to finish the day just one point off Monday’s close. Friday gapped down at the open to test Tuesday’s low within the first 30 minutes, then rallied to fill the gap, but reversed and accelerated lower on the latest Tariff Man threat to “order US companies to find an alternative to doing business in China”. From there the markets continued lower to make the low of the week at 2835, before closing above at 2847. Volatility continues for the fourth week in a row.
For the week, SPX/DOW lost 1.44%/0.99% while NDX/NAZ lost 1.83%/1.83%.
On the economic front, Existing Home Sales increased, while new Home Sales declined. Initial and Continuing Claims both declined. The ECRI was down slightly just below the zero line, but still holding higher lows for its uptrend this year.

Next week economic news comes from Durable Goods, Consumer Confidence, GDP, Personal Income and Spending, PCE and Consumer Sentiment.
LONG TERM: Uptrend may be weakening

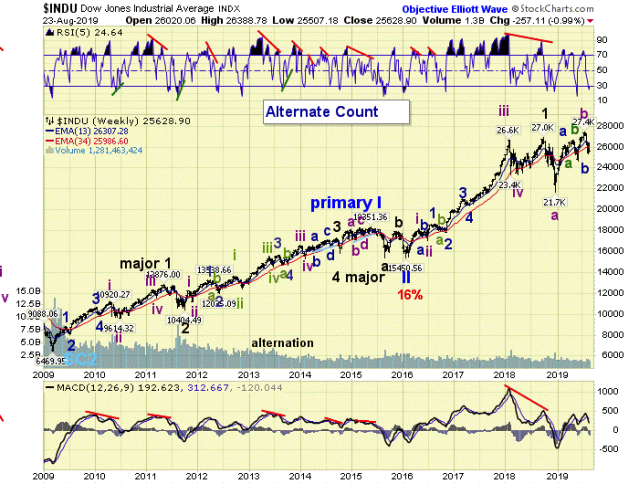
In the US, the long-term count remains unchanged with the Super Cycle SC2 low in March 2009. The Primary wave I high occurred in May 2015 and Primary wave II low in February 2016. Primary wave III has been underway ever since and the Major wave 1 high of Primary wave III occurred in October 2018. Based on price action this week, the Major wave 2 low in December 2018 has come into question. As a result, we’ve updated the DOW charts with an alternate count to reflect the possibility of an extended Major wave 2, which suggests that Intermediate wave b high occurred in July 2019 and Intermediate wave c has been underway since then. We continue to carry our primary count on SPX until more data becomes available, which suggests Intermediate wave i of Major wave 3 is underway from the December low and is subdividing into Minor and Minute waves.
Based on concerns discussed last week about the move in bonds, we’ve been searching our historical OEW data set for clues of a pending change in the share markets. We got the first signal of a potential crack in the long term charts this week as three of the four key US markets we track closed below the long term EMAs. DOW is now below for two weeks in a row, while NDX is the one holdout but only by a slim margin. This price action can be associated with the end of a medium term downtrend in context of an ongoing bull market, as long as it reverses quickly. However, a sustained series of closes below would be concerning and give credence to our alternate DOW count.
The second clue came out of all the recent attention in the media about a pending inversion of US Treasury maturities 2’s/10’s. Most of the focus seems to be whether an inversion has occurred and if it signals a recession, and even some of it may be political. We’re looking at it instead from a purely OEW viewpoint. We noticed since mid-1970 there’s a cycle in the data, that’s currently overdue with the trend clearly in place for inversion, https://fred.stlouisfed.org/series/T10Y2Y/. Given that, we checked data going back to the mid-1950’s for these kind of events against our OEW historical data set and found an 80% correlation with either the end of OEW bull markets or the beginning of OEW bear markets. It’s a limited set of data points, so not statistically significant, but nonetheless, enough for us to consider the alternate count.
MEDIUM TERM: Downtrend

SPX opened the week with a strong gap up but ran into resistance right our 2929 pivot. Every day it tried to breach that level, was unable to close above, and maxed out with an intraday test on Thursday at 2939. Although the reversal on Friday did not take out the prior lows, we believe it was sufficient to invalidate our medium pattern for Minute wave ii. Consequently we’ve updated the count to show another extension underway, which gives Micro wave a = 2826, Micro wave b = 2839 and Micro wave c ongoing. Turns out the glass may have been half empty, since NAZ and NDX are having difficulty sustaining higher lows as discussed last week. In order for this new count to remain viable, we would target Micro wave c at the 0.618x ratio with Micro wave a, which suggests a bottom around 2812. If it extends much below that, we would have to consider a possible extension of Minor wave 2, or maybe even revert to the alternate bearish count shown on the DOW (chart below). Another concern is the Tariff Man Tweets, which suggests a minimum decline down to the June low around 2727. Our alternate count suggests the market may have topped at the July high of 3028 and is now extending the Major wave 2 from the December low. A SPX rally back above 2940 or so will reverse the pattern and possibly extend Micro wave b. A break below 2822 will further confirm the extension of Minute wave ii.

Medium term, RSI ended the week down but still in the neutral zone and MACD flipped from a bullish to bearish cross.
SHORT TERM

For the second week in a row, SPX was unable to impulse higher off of the previous week’s rally, and again failed in the same region, this time at the intraday high of 2939 on Thursday. Last week it failed at 2943. This time it started strong on Monday, but chopped around the highs in corrective fashion generating three small waves up to 2943, before collapsing back down on Friday to test just nine points off the prior low and right on our pivot at 2835. This now suggests a likely extension of Minute wave ii, so we’ve updated the short term count such that the failed flat at 2826 becomes Micro wave a, Micro wave b is a zig-zag pattern at 2939 and Micro wave c is ongoing with only one wave down to 2835 so far. The week closed up off the low at 2847, which could be the beginning of the next small wave up, but more data is needed to qualify that. For now, we’re focusing only on the SPX bullish count until that pattern is broken. The bearish alternate is posted on the DOW chart below.

Short term support is at the 2835 and 2798 pivots. Resistance is at 2858 (typo on hourly chart should read 2858) and 2884 pivots. Short term RSI ended the week oversold.
FOREIGN MARKETS
Asian markets (using AAXJ as a proxy) gained 0.33%.
European markets (using FEZ as a proxy) lost 1.48%.
The DJ World index lost 0.44%, and the NYSE lost 1.30%.
COMMODITIES
Bonds are in an uptrend and gained 0.04%
Crude oil is in a downtrend and lost 1.17%
Gold is in an uptrend and gained 0.92%
GBTC is in a downtrend and gained 0.08%.
The USD is in an uptrend and lost 0.49%.
CHARTS: https://stockcharts.com/public/1269446/tenpp
Have a good week!

The difficulty is that Elliott Wave counts are as numerous as there are analysts out there. And… there is one count that suggests iii of 3 of intermediate (4) or even start of supercycle A wave down starts as early as next week.
I see some huge red flags out there. People dismissing the drop off yields to historic lows. People shrugging off the historic weakness in weekly and monthly RSI. People putting a blind eye to the synchronous rising of market, metals and oil as if that could be perfectly normal. Faang leaders unable to pull above aths for nearly two years.
I for one do not see a bullish ending to this.
LikeLiked by 2 people
Think we are about to enter a new reality pretty soon, real economy taking the lead and all the fluff fading into the background. Part of it will be caused by global cooling and part of it by lack of investments in the commodity space after a relebtless downturn past 2007. A healthy mix of scarcity is emerging, inflation and growth could be around the corner.
LikeLiked by 1 person
E, your main difficulty with EW is that you’re always changing your counts every five minutes.
You spend your entire day in the Red Dragon chatroom, talking about market crash scenario’s.
What brings you over here?
You must be getting pretty desperate.
LikeLiked by 1 person
Interesting you say that. I actually do not change my count often. That is why I still see potential for the crash scenario where others are dismissing it. I also started from this site and have not seen value in posting here until now again when the bearish potential seems quite probable again.
LikeLiked by 2 people
We’ve waited long enough. Time for the Bears to return.
LikeLiked by 3 people
?
LikeLiked by 1 person
Erratic wild swings since January 2018 coincides with trade War angst. Will the new deadline of Sept. 1st affect next weeks move? I assume no news this weekend will solidify Sundays new tariffs. China indicating there is NO NEW TALKS!
Have no clue on how we react given the multiple deadlines and ramping up war over last 2 years.
The chart says we have one more move up. Candlestick patterns on the 5 hour charts say the same. The longer term assumption of 2960-80 range on SP 500 seems to be doable early next week.
I suspect a carry over from weekend (IF) no new news develops results in a spike move up early in week. no bets at this time. if we hit my targets in time frame described i will bet for another sharp drop after. If we start Tuesday decidedly down I will also conclude the next deep drop started.
Either one more spike move up or we already started the slide. That’s my take.
LikeLiked by 1 person
it doesnt MATTER
m Wags / Bluehorsehow/ Money Maker
are just a few of MANY aliases
i have about 10 email addresses
that are most likely him hounding me about EXAS
that i have blocked
DO NOT ever let him find out your email address
LikeLiked by 3 people
He had a falling out with someone at danerics a few years ago who gave him his comeuppance. The guy subsequently posted the troll’s phone number and a few unflattering pictures of him which I have.
He is a very sick man.
LikeLiked by 2 people
It seems like there’s a lot of people with external history with him posting insulting comments about him. But in terms of his history on this site, from what I can see, he’s only ever posted using Bluehorse and Mwags and has never pretended to be multiple people, Bluehorse and Mwags have always clearly been the same person.
In terms of content, he’s one of the most well informed contributors, even if there’s a bit too Exas going on from time to time. So don’t really get the hating
LikeLiked by 2 people
Thank You Mcg.
Ive always found that traders concentrate on the markets.
And then there are those that dont have any risk capital, rarely trade, got clobbered by following Prechter years ago anticipating P3, and spend their day yapping about others and trolling.
Hope you are enjoying your Weekend!
LikeLiked by 1 person
What are you talking about? You have claimed before that by following Prechter in the early 90s he cost you $42,000, blew up your account and you haven’t been the same since.
True story.
Perhaps maxcherry could corroborate this as being the case.
LikeLike
https://www.cnbc.com/2015/09/10/diamond-prices-hit-by-stock-market-slump-china.html
Diamond prices has fallen along with precious metals, could a reversal be near ? Lots of miners to choose from at low valuations. Those who survive might be good buys, when it turns. Ok $SSEC could close the gap and retest 2005 prices, but if not there may be buyers for diamonds too 🙂
LikeLike
Tore
this article is from 2015
LikeLiked by 1 person
ouch, it fitted so well with one I red in a Norwegian newspaper today. Slump must have worsened considerably since then.
LikeLike
Hope the chart is better than the News, well I wasnt a news person anyway 🙂
LikeLike
heres the thing tore ….
as previously discussed
GOLD can go to 2000 dollars
and gold miners can still go bankrupt
thru mismanagement , lawsuits , embezzlement and just plain bad luck
i just want the commodity
LikeLike
so same is true of any miner ….
diamond , gold etc
LikeLike
Agree its risky, all miners are risky, but rewarding if you are spot on; look to JNUG. I have had my share of bancrupcies, and they are bitter and hard to swallow 🙂
That being said there is a reasonable chance metals might go big, it all depends on China. Constructed a chart (a long time ago) forecasting a new all time top for the SSEC.
Tony also mentioned SSEC turning somwhere in the doldrums, but it has been a slow grind to say the least. I think the lulls are coming to an end and that we are in for a large move soon.
LikeLiked by 1 person
Looks like SNP cash tonite will do a classical abc failure to the down side below 2822, by breaking reversed upwards and closing above the bears invalidation point of 2943 is a good enough reason for the mkt to change the short term negative trend to positive. Medium and Long term investors should be comfortable with their long positions as the SNP unable to break down below 2728. Still no recession in sight before year end as macro fundamentals have not deteriorated. Although the 10 years/2years inverted in August, potential recession will only come in about between 1.50 and 2 years time. OEW wave count targeting 3300 does not seem to be far fetched down the road althought many Elliott Wave technicians are pointing towards a waterfall crap out towards the 2100 levels.
LikeLiked by 3 people
Someone hacked into your account to publish personal details of a poster that only you have access to????New low even for you Lunk well done!!!
LikeLiked by 1 person
hey who hacked my blog?
iamnotviv sounds kinda Russian
LikeLiked by 5 people
LikeLike