
Weekend Report
Provided by the OEW Group
August 10 2019
SPX started out the week with a large gap down and continued lower till late afternoon, to make the low of the week at 2822, before a brief rally to finish Monday down at 2845. Last week’s close was 2932. Tuesday gapped down again and retested within a few points off the low in the first 20 minutes of trading, then made a strong rally for the rest of the day with only one small pullback along the way, to finish higher at 2884. Thursday gapped higher and continued to rally straight up with no pullbacks to finish the day just off the high at 2938. Friday opened lower and continued down to 2900 by noon, then reversed course and rallied back to close the week at 2919. A consecutive week of volatility!
For the week, SPX/DOW lost 0.46%/0.034% while NDX/NAZ lost 0.60%/0.56%.
On the economic front, Crude Oil Inventories, Consumer Credit and MBA Mortgage Application Index increased, while ISM non-Manufacturing Index decreased. JOLTS were little changed.
Next week economic news comes from the Treasury Budget, CPI, Core CPI and Import Prices.
LONG TERM: Uptrend

In the US, the long-term count remains unchanged with the Super Cycle SC2 low in March 2009. The Primary wave I high occurred in May 2015 and Primary wave II low in February 2016. Primary wave III has been underway ever since. Major wave 1 high of Primary wave III occurred in October 2018 and Major wave 2 low in December 2018. Intermediate wave i of Major 3 is now underway and is subdividing into Minor and Minute waves. Despite the recent volatility and calls by some for the end of this bull market, we see no evidence yet to suggest these subdivisions are anything more than typical medium term downtrends in context of an overall bull market profile. We will update the long term status, if/when anything develops to change this view.
MEDIUM TERM: Downtrend

SPX opened lower for the second week in a row and accelerated down, but seemed to find a near term bottom on Monday at 2822. This gives 200+ points so far for this Minute wave ii downtrend that we believe has been underway since mid-July at the 3018 early top. Although it’s exceeded the typical 5% decline mentioned last week, the 6.5% decline so far is still within the norm for this bull market. SPX retested the low on Wednesday for an apparent double bottom, then rallied back above the 50% retracement zone, but ran into resistance there. Consequently, we updated our medium term status to reflect a potential Minute wave ii bottom with the possibility of another retest before it’s complete. A rally above 2950 or so will further confirm the Minute wave ii bottom. If SPX breaks lower, then we will revaluate.
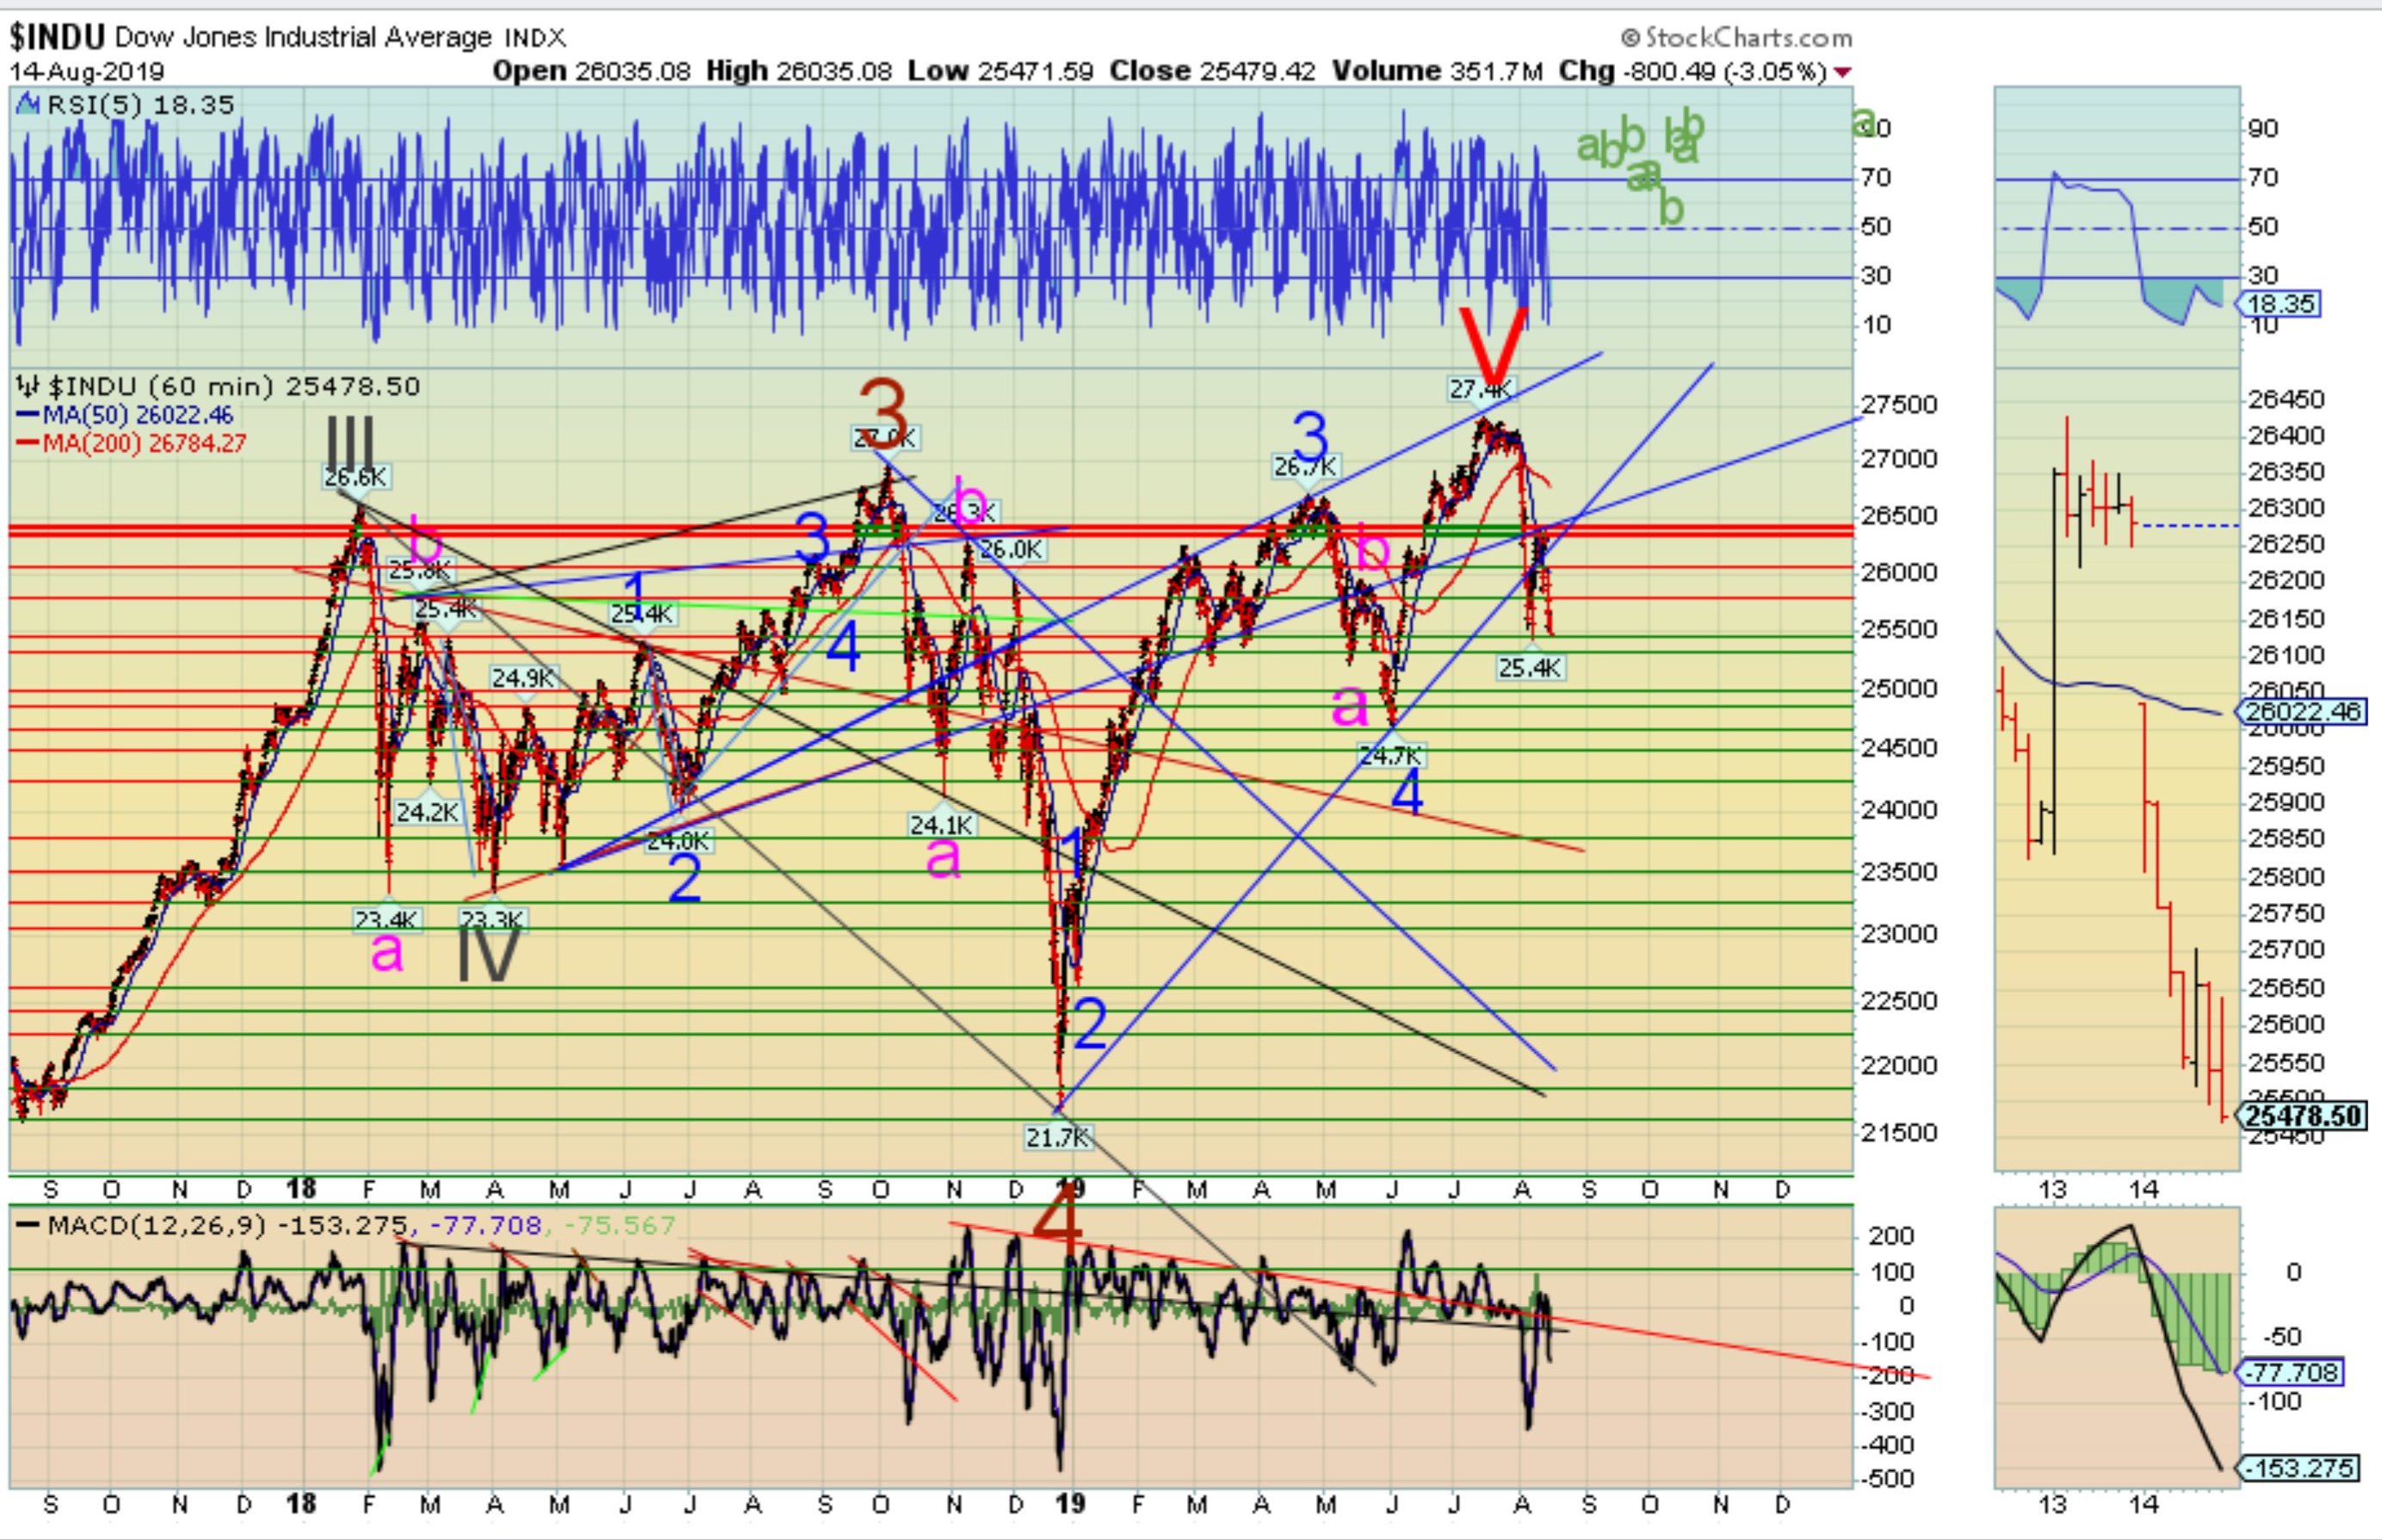
Some in our group pointed out a possible correlation of this downtrend with prior declines triggered by Tariff Man Tweets (TMT). We’ve had three occurrences of these tariff threats since December and each time the market sold off in the 200+ point range. We’ve annotated the medium term chart to show this effect. The May selloff bottomed after a 200+ point decline. The Dec selloff paused at 200+ points, but then continued lower after Fed autopilot comments (PAP on chart), which likely contributed to that extension.
SPX followed the DOW profile from last week and got extremely oversold at the low, the most so since Major wave 2 last December. We will be watching the short term waves for direction of the pending rally. Although we still expect Minor wave 3 to exceed the 3300 level, our medium target for Minute wave iii will be updated after it becomes clear that a new uptrend is underway.
Medium term, RSI is in the neutral zone and MACD is turning back up. DOW generated a positive divergence off the low on Wednesday.
SHORT TERM

SPX gapped down and blew right through our support targets mentioned last week to reach beyond the 61.8% retrace level of Minute wave i, but was able to close above that level at 2845. From there, SPX rallied to fill the gap and close the week back above the 38.2% retrace level at 2919. We noticed a pattern developing this week based on our qualified small waves and short term tracking techniques, so we adjusted the count accordingly. We continue to track the irregular Minute wave ii previously discussed, but have rescaled the count to reflect a double three pattern. That gives an irregular zig-zag for Micro wave a, [3018]-2973-3028-2958, followed by Micro wave b single wave rally to 3014. Micro wave c then suggests a potentially complete zig-zag pattern at the low [3014]-2914-2944-2822. We can also make a case for an elongated flat into the higher low at 2826, but either one suggests a completed double three pattern from the Minute wave i top. From there, we can count two waves up from the failed bottom, [2826]-2939-2900, with a potential third wave still developing. There’s still a possibility of another retest of the low as shown with the optional ii/a label on the chart. We’re waiting to see if this rally can impulse or is going to fade into another b-wave.
Short term support is at the 2884 and 2858 pivots. Resistance is at 2929 and 2957 pivots.
FOREIGN MARKETS
Asian markets (using AAXJ as a proxy) lost 2.07%.
European markets (using FEZ as a proxy) lost 0.36%.
The DJ World index lost 0.90%, and the NYSE lost 0.71%.
COMMODITIES
Bonds are in an uptrend and gained 0.64%
Crude oil is in a downtrend and lost 2.08%
Gold is in an uptrend and gained 3.50%
GBTC is in a downtrend and gained 0.20%.
The USD is in an uptrend and lost 0.11%.
CHARTS: https://stockcharts.com/public/1269446/tenpp
Have a good week!

phil1247 says:
August 14, 2019 at 8:02 pm
look for da boyze to squeeze em up to 2860 overnite
>>>>>>>>>>>>>>>>>>>>>>>>>>>>>>>>>>>>>>>>>>>>>>>
actually i thought they would get to 72 ….( 38 special)
but that just happened now
so i took an initial short just below 2872 just after 8 am
LikeLike
Next leg up starts today on the SPX with new highs coming…dont miss it!Latter Aug very bullish seasonally!
A
LikeLiked by 2 people
What the..???You guys watching this?NEWS?
LikeLike
https://mobile.twitter.com/4xInsight/status/1161963801975119872
Fade it IMO
LikeLiked by 2 people
Not this one..correction is done!
A
LikeLiked by 1 person
Be careful here.. said this before, but I find it much much harder to see what’s going on if I look only at SPX. FTSE gives me much better signals generally. We’ve just broken 7100 today which is a critical level and has held multiple times since February. Another couple of percent down in that before a proper bounce.. think SPX will find short term support in 2700s
LikeLike
Margin Call Mark, the long term trend is still up. Your sock puppet will surely show up, so here’s some advice for the both of you.
learn how to read, get a job, and get a life
LikeLiked by 2 people
Lol you’re blind dude.. left a job that someone of your intellectual capacity could only dream about acquiring. Why waste your life working when you can make money trading and have lots of free time? You need one because you aren’t profitable lol
LikeLike
Phil certainly doesn’t need a job, he keeps on finding the pivots over and over!
LikeLiked by 1 person
will you ever learn you are wasting your time with news?
LikeLike
https://vantagepointtrading.com/stock-market-is-not-physics-part-iii/
even if you had the news a day earlier
you would still lose
LikeLiked by 2 people
Give it to them!
LikeLike
Looks like swamper1 forgot to do his homework… maybe he can post one of his upside down charts lol. This is what happens when you don’t know what you’re doing, silence is deafening
swamper1 says:
August 13, 2019 at 12:45 pm
Mark, the long term trend is still up. You’ve already missed 600 SPX points, do you really want to miss another 300-400 pts to the upside?
Instead of spewing nonsense, best you do your homework.
swamper1 says:
August 13, 2019 at 1:04 pm
Please let us know when you start buying at the 3200-3300 level. It shall be coined as “the fade of the year” for most of us. Btw, are you reading the long term charts upside down?
LikeLiked by 4 people
SPYTrader – I consider myself unbiased when it comes to American politics, I’m not American so I don’t have any links to either side. So just saying it as I see it from the outside looking in. Trump has made a mistake in tying the success of his presidency to the strength of the economy and the markets, especially because when he was elected it was 7 years into an economic expansion. If he’s going to try and take the credit on the way up he’s going to get blamed on the way down, and odds were always in favour of a recession coming somewhere between years 7-11 of the expansion given past history.
Secondly, tariffs and disrupting supply chains are always going to be a negative catalyst for growth. He’s shown a lack of understanding on this issue IMO. How many times has he threatened tariffs on various countries and then pulled back on it. He seems to think that as long as he doesn’t go too far with it that it will all be fine, but the fact that businesses know he might just randomly do it affects confidence and makes them hold back on investment which slows growth.
Lastly, he pushes the America first agenda, which he was elected on and is entitled to do. But there are consequences to that. Through globalisation, economies have become much more linked over the last 20 years than they were in the past. So if growth slows elsewhere it will have a much stronger impact on the US economy than was the case historically. So whilst he may see it as winning to get a bigger share of the pie, the pie itself is smaller because growth slows when he puts up barriers to trade or makes companies move their labour force back to the US when it’s cheaper to outsource. If China slows down that has a massive effect on the markets, which in turn disproportionately affects the US.
So in summary, he can do what he thinks is best but there are consequences to it. And a recession is due anyway, he’s just providing a catalyst for it to happen.
LikeLiked by 4 people
Thanks for your unbiased view. mcg
It probably does seem to many that Trump operates with abandon.
His business experience started mid ’70s, when NYC was in financial chaos, the nadir.
The City had actually defaulted on Municipal Notes.
NYC Mayor Abe Beame proudly announced “the bond holders can go to hell”.
That’s when Trump pulled off his first turnaround miracle “The Commodore Hotel”.
Several followed.
About the same time, NY State had to step in and structure an agency called “Municipal Assistance Corporation” (MAC), served as a foundation for resurgence of NY City.
Then, within a few years, the bear market of 1966 – 1982 ended.
Trump was holding a handful of aces.
But that was then, this is now.
Nobody is pulling any aces.
You are correct.
Trump is confident to a fault.
MHO
LikeLiked by 4 people
MCG the biggest problem in america is the media. It’s all bias propaganda in favor of left / liberals. fox on the right. USA media is no different than russia. years ago the media could at least keep politicians in line with fair reporting. Now there is no one investigating and reporting “real” news.
if anyone disagrees with me, you are a racist. see how that works.
LikeLiked by 2 people
Cr. to CBZ
LikeLike
Flip Flop.
LikeLiked by 2 people
IMVHO todays decline was quite exaggerated.
Today was another fantastic opportunity to jump in. With interest rates so low, the economy will do far better than current expectations. Also IMVHO, due to tough political positioning on trade since negotiations began, investors have had time to re position themselves. We are used to it already. Its one of the best things that has happened to America. It can only get better.
LikeLiked by 2 people
Huh?
Rates have been pretty low for awhile and it hasn’t helped.
LikeLiked by 1 person
A Danish person recently received money back from sitting on a house loan. Thats like money for nothing 🙂 “Something is rotten in the state of Denmark”, well not for this house sitter 🙂
LikeLike
Rates are low? Like Japan for the last 3 decades or now Western Europe? I’m not saying we are either but low rates is not a reason to be bullish or suggest stocks are a buy.
LikeLike
DOW Jonestown to 1000 to correct 5 waves up from 1932???

LikeLiked by 2 people
LikeLike
xEVAx you might be getting a bit ahead of yourself with dow 1000
LikeLike
Not if we consider the bull as just a rally within a bear market, then……
Love Eva’s charts and really miss her working alongside adding funny dialogue…. I have numbers but no script….
LikeLiked by 1 person
Agree I still have this as being a major 2 looking for 2118 or there abouts and Dow 19900-300 Dow has a gap at 19898 or
LikeLiked by 1 person
Guesswork scenarios, bullish and bearish…
LikeLiked by 4 people
123
i like your style…………
even the bearish scenario…. is BULLISH !
LikeLike
haha! 🙂 Yes, I think overall the market remains bullish; and, no concern unless the 2656 OEW pivot is broken.
LikeLike
123 thanks for the chart. i think you need 1 more chart to consider this as P4 and goes down to 1850 – 2200 level
LikeLiked by 4 people
abc, do you have a website where you update your charts? I do like your work as well.
LikeLike
Only post charts here —not really different to OEW charts to warrant a new website !
LikeLike
123abc- couple of observations: (2nd chart above)
1. your “b” is 5 waves? corrective?
2. on “b”, appears your nano ii is larger than micro 2. Wouldnt that be a degree violation?
3. Are you trying to show an exp flat corrective 2 (abc)? Or is this a w-x-y? If a flat, wouldnt your “c” be the 5 wave leg rather than “b”?
Just trying to follow your logic here.
Thanks!
LikeLike
1. Technically speaking, a wave-b ought to be 3 corrective waves in traditional EW and perhaps in OEW too. However, if it can be counted as 5 impulsive waves without any impulsive rule violations, then personally don’t see any conflicts. Furthermore, an irregular wave-b which exceeds the prior orthodox top perhaps could occasionally have impulsive characteristics? As long as an irregular wave-b overall doesn’t exceed 1.618 the length of wave-a, the internal structure labelling of it may be considered inconsequential and cosmetic.
2. A smaller degree wave doesn’t mandate it must be smaller in price or time —this is especially true of OEW.
3. Second chart illustrates a projection of an Irregular/Expanded Flat. Under traditional EW, this would unfold as a 3-3-5 and labelled as an a-b-c. If it were to unfold as a 3-3-3, then it would be labelled as a w-x-y. In either scenario, OEW would label it as an a-b-c structure. So as long the overall Flat structure maintains Fibonacci relationships between its internal waves, the overall labelling is cosmetic.
LikeLiked by 1 person
123abc – first, thanks for taking time to respond!
Im not familiar with OEW (if its different from EW in general), so that could be an issue here for me. With that in mind, I’ll just leave it at that.
Thanks again. :o)
LikeLike
Thanks for this detailed analysis. We need more of this stuff and less bickering…
LikeLike
Still believe that (x) was at recent high, Plan to see a vicious ABC to around 2150 around Q4. B wave to start around 2666 and go to 2800 then continue vicious drop to 2150 for completion of C wave. Wave 4 won’t be completed until Q2 2020. Expecting to end below 2000 with a triple zig zag downward triangle. Most folks here not giving Wave 4 the time it needs in reference to run up since 2009. When it pops out out ending downward triangle….hello Wave 5 to 3600-4100. GL all
LikeLiked by 4 people
How about a chart illustrating what you expect?
LikeLike