Weekend Report
Provided by the OEW Group
August 10 2019
SPX started out the week with a large gap down and continued lower till late afternoon, to make the low of the week at 2822, before a brief rally to finish Monday down at 2845. Last week’s close was 2932. Tuesday gapped down again and retested within a few points off the low in the first 20 minutes of trading, then made a strong rally for the rest of the day with only one small pullback along the way, to finish higher at 2884. Thursday gapped higher and continued to rally straight up with no pullbacks to finish the day just off the high at 2938. Friday opened lower and continued down to 2900 by noon, then reversed course and rallied back to close the week at 2919. A consecutive week of volatility!
For the week, SPX/DOW lost 0.46%/0.034% while NDX/NAZ lost 0.60%/0.56%.
On the economic front, Crude Oil Inventories, Consumer Credit and MBA Mortgage Application Index increased, while ISM non-Manufacturing Index decreased. JOLTS were little changed.
Next week economic news comes from the Treasury Budget, CPI, Core CPI and Import Prices.
LONG TERM: Uptrend
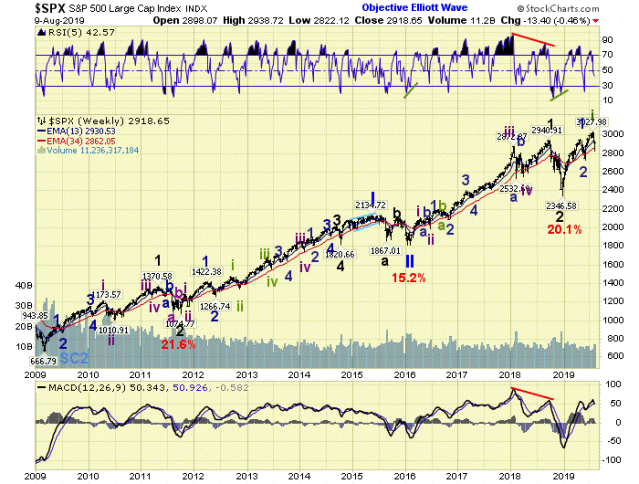
In the US, the long-term count remains unchanged with the Super Cycle SC2 low in March 2009. The Primary wave I high occurred in May 2015 and Primary wave II low in February 2016. Primary wave III has been underway ever since. Major wave 1 high of Primary wave III occurred in October 2018 and Major wave 2 low in December 2018. Intermediate wave i of Major 3 is now underway and is subdividing into Minor and Minute waves. Despite the recent volatility and calls by some for the end of this bull market, we see no evidence yet to suggest these subdivisions are anything more than typical medium term downtrends in context of an overall bull market profile. We will update the long term status, if/when anything develops to change this view.
MEDIUM TERM: Downtrend
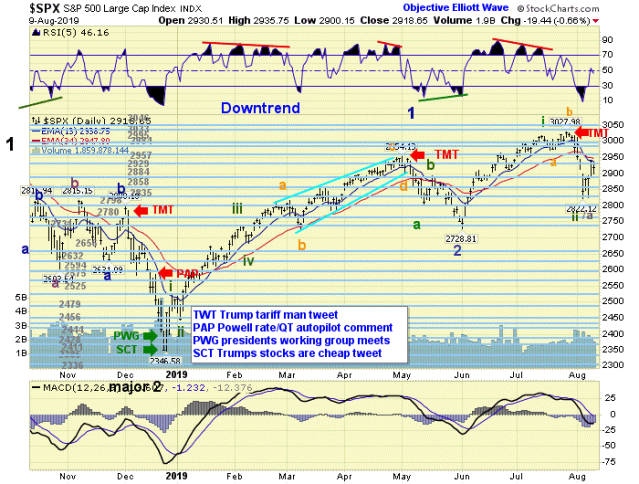
SPX opened lower for the second week in a row and accelerated down, but seemed to find a near term bottom on Monday at 2822. This gives 200+ points so far for this Minute wave ii downtrend that we believe has been underway since mid-July at the 3018 early top. Although it’s exceeded the typical 5% decline mentioned last week, the 6.5% decline so far is still within the norm for this bull market. SPX retested the low on Wednesday for an apparent double bottom, then rallied back above the 50% retracement zone, but ran into resistance there. Consequently, we updated our medium term status to reflect a potential Minute wave ii bottom with the possibility of another retest before it’s complete. A rally above 2950 or so will further confirm the Minute wave ii bottom. If SPX breaks lower, then we will revaluate.
Some in our group pointed out a possible correlation of this downtrend with prior declines triggered by Tariff Man Tweets (TMT). We’ve had three occurrences of these tariff threats since December and each time the market sold off in the 200+ point range. We’ve annotated the medium term chart to show this effect. The May selloff bottomed after a 200+ point decline. The Dec selloff paused at 200+ points, but then continued lower after Fed autopilot comments (PAP on chart), which likely contributed to that extension.
SPX followed the DOW profile from last week and got extremely oversold at the low, the most so since Major wave 2 last December. We will be watching the short term waves for direction of the pending rally. Although we still expect Minor wave 3 to exceed the 3300 level, our medium target for Minute wave iii will be updated after it becomes clear that a new uptrend is underway.
Medium term, RSI is in the neutral zone and MACD is turning back up. DOW generated a positive divergence off the low on Wednesday.
SHORT TERM
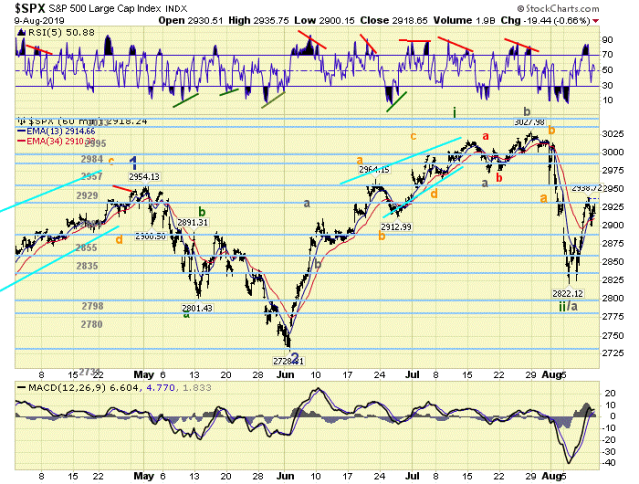
SPX gapped down and blew right through our support targets mentioned last week to reach beyond the 61.8% retrace level of Minute wave i, but was able to close above that level at 2845. From there, SPX rallied to fill the gap and close the week back above the 38.2% retrace level at 2919. We noticed a pattern developing this week based on our qualified small waves and short term tracking techniques, so we adjusted the count accordingly. We continue to track the irregular Minute wave ii previously discussed, but have rescaled the count to reflect a double three pattern. That gives an irregular zig-zag for Micro wave a, [3018]-2973-3028-2958, followed by Micro wave b single wave rally to 3014. Micro wave c then suggests a potentially complete zig-zag pattern at the low [3014]-2914-2944-2822. We can also make a case for an elongated flat into the higher low at 2826, but either one suggests a completed double three pattern from the Minute wave i top. From there, we can count two waves up from the failed bottom, [2826]-2939-2900, with a potential third wave still developing. There’s still a possibility of another retest of the low as shown with the optional ii/a label on the chart. We’re waiting to see if this rally can impulse or is going to fade into another b-wave.
Short term support is at the 2884 and 2858 pivots. Resistance is at 2929 and 2957 pivots.
FOREIGN MARKETS
Asian markets (using AAXJ as a proxy) lost 2.07%.
European markets (using FEZ as a proxy) lost 0.36%.
The DJ World index lost 0.90%, and the NYSE lost 0.71%.
COMMODITIES
Bonds are in an uptrend and gained 0.64%
Crude oil is in a downtrend and lost 2.08%
Gold is in an uptrend and gained 3.50%
GBTC is in a downtrend and gained 0.20%.
The USD is in an uptrend and lost 0.11%.
CHARTS: https://stockcharts.com/public/1269446/tenpp
Have a good week!


IMVHO we are going to be moving much higher. We closed with a very bullish pattern for tomorrow.
LikeLiked by 1 person
Trashing others is a rule, yet after my liking Tore’s reply, I was trashed by Schizo and Phil.
But dear readers why did he do this and then go on Linker’s site to say he was only interested in bonds
Perhaps to shut down this blog.
LikeLike
Fiona,
When I came back to posting on this blog late last year from a hiatus, I was totally hounded by a guy named “Lunker”.
I would post a half-dozen times a day, and he would repeatedly tell me that there was a 3 post rule. Because I was “new” and because he never posted about the market, I thought that “Lunker” must have been some kind of official Moderator. But for some strange reason, this 3 post rule didnt apply to his buddy Phil.
The hypocrisy here is palpable.
LikeLike
Hi Fiona ! It’s becoming more difficult, but I insist on checking in here every once in a while, to see what you and and a couple of other bright minds have to say. Thanks, stay well !
LikeLiked by 1 person
What a delight David…but why is it becoming more difficult??
I hope all is well and you are just too famous to find time……x
LikeLiked by 1 person
Fiona,
You comments have more value so ignore the trolls. By the way, the Friday’s rally will continue next week. Good luck.
LikeLiked by 1 person
…but you know Page, Lunker runs a really professional blog and doesn’t allow anyone to take over. Well, why would he..he does really good charts, has interesting commentators, so everyone plays by his rules …thus the only place to run amok in is Tony’s blog and if it is shut down, why care…back to Linker’s……
LikeLiked by 3 people
Stop it Fiona.
Youre making too much sense.
🙂
LikeLiked by 1 person
LikeLike
Just an FYI:
10 years ago I subscribed to Nenner.
I found his subscription to be extremely expensive, given what he was offering. And more often than not, he used terribly wide stop-losses that invariably got triggered. I didnt really think that his analysis was any better than a coin-flip. And at the end of the day, his trades with stops with terribly wide parameters were a deal-breaker for me.
In 2015, Nenner was calling for the Dow to hit 5,000 using cyclical long-term patterns. He said that the decline would start in earnest in late 2017 and go into 2020.
In March of 2018 he said “We’re Totally Out of Stocks”…. which was the month that a major secondary low was recorded at 2550 SPX which lead to a 400 point rally in just 5 months.
For me, Nenner has been no better than someone like John Hussman.
LikeLiked by 1 person
Just pointing out how difficult it can be, he is a bit on and off, but got he gold right. This far 🙂
LikeLike
Everything you wanted to know about the U.S Trade Deficit but were afraid to ask:
View at Medium.com
LikeLike
2 counts, bottom here or extension downwards if it does not hold.
LikeLiked by 1 person
tore,
any way to enlarge your charts? Clicking does not do the justice.
LikeLike
dont think so, try the magnify optionon the pc, not perfect but hope it will do.
LikeLiked by 1 person
Mark
do you think i could pass as a brit ?
is the wording good or no ?
LikeLike